A typical flight from London to NYC emits about 1,180 tonnes of CO2e. Is that a lot? Is that not much? How does it compare with other natural and human-made emissions???
Picturing it is quite hard, so we did it for you, have a look:
Tonnes, gigatonnes and equivalent tonnes
Greenhouse gas emissions are typically measured in tCO2e (tonnes of CO2 equivalent), but how much is a tonne and what does “equivalent” mean?
- tCO2e: greenhouse gases are typically given as tCO2e – tonnes of carbon dioxide equivalent. The equivalent means that the measurement includes greenhouse gases which aren’t carbon dioxide, converted into equivalent amounts of CO2 based on warming potential e.g. methane which has 28–36 times the global warming potential of CO2, so 1 tonne of methane would count as 28–36 tonnes of CO2e.
- 1 gigatonne (Gt) = 1 billion tonnes
- 1 tonne (t) = 1,000 kilograms
- 1 kilogram (kg) = 1,000 grams
To make it easier, here’s a couple things we’re familiar with to visualise these weights:

Humans vs. 🌋 volcanoes
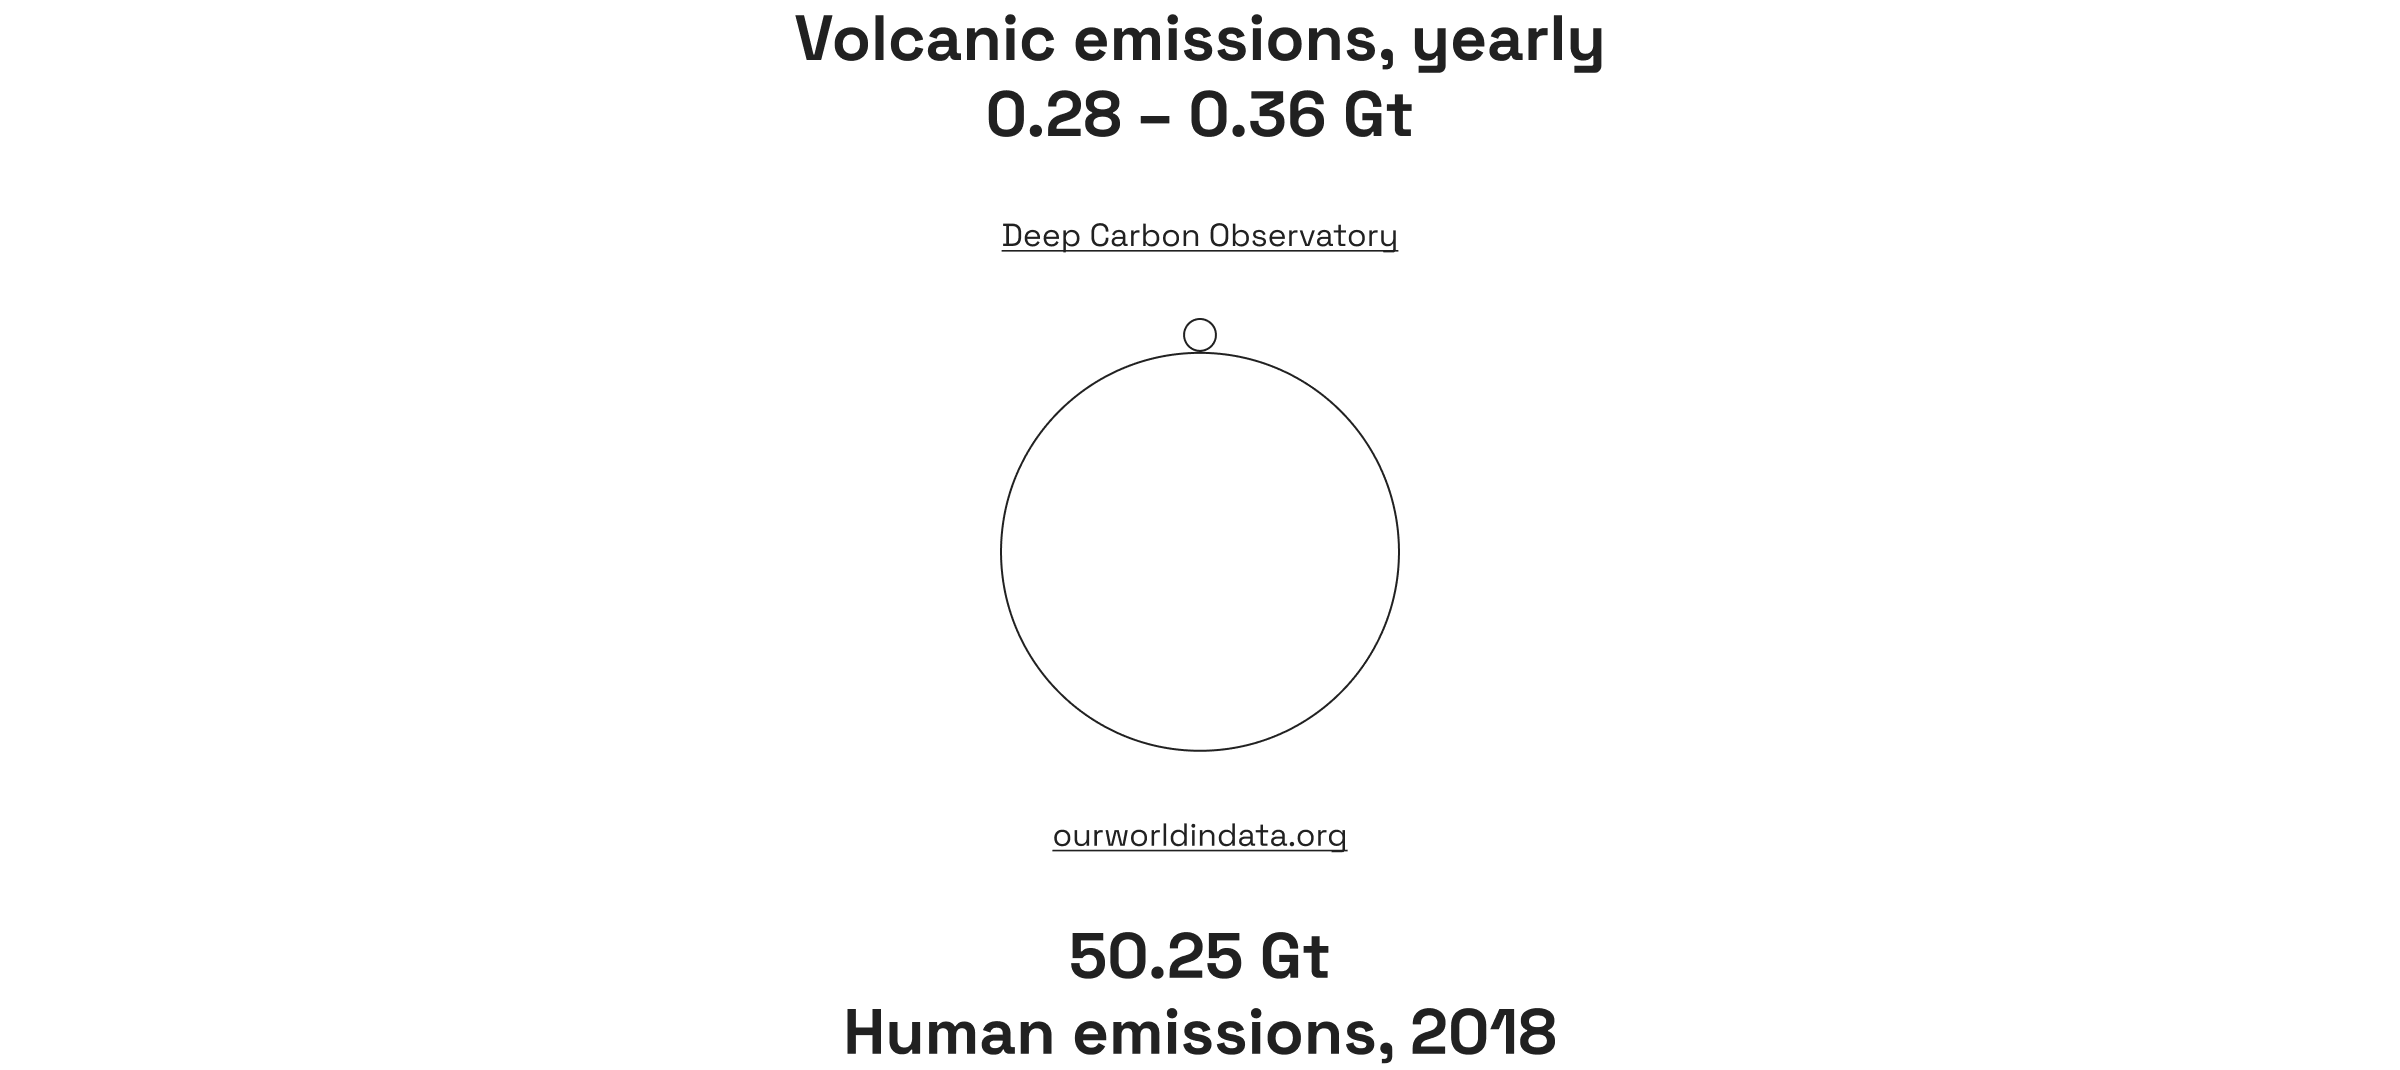
Volcanoes are pretty mighty, right? They spew fire and gases all year round, across the globe, above surface and underwater. So we wondered, how do our emissions stack against volcanoes?
If you thought they emit more, you’re wrong. Yearly human-made emissions top those coming from volcanoes globally, both above and underwater. And not by a little bit more. 139 times more.
That’s a conservative number, as yearly volcanic emissions globally are estimated between 0.28–0.36 Gt of CO2e. That means we “win” on volcanoes between 139:1 and 179:1.
Humans vs. 🔥 wildfires
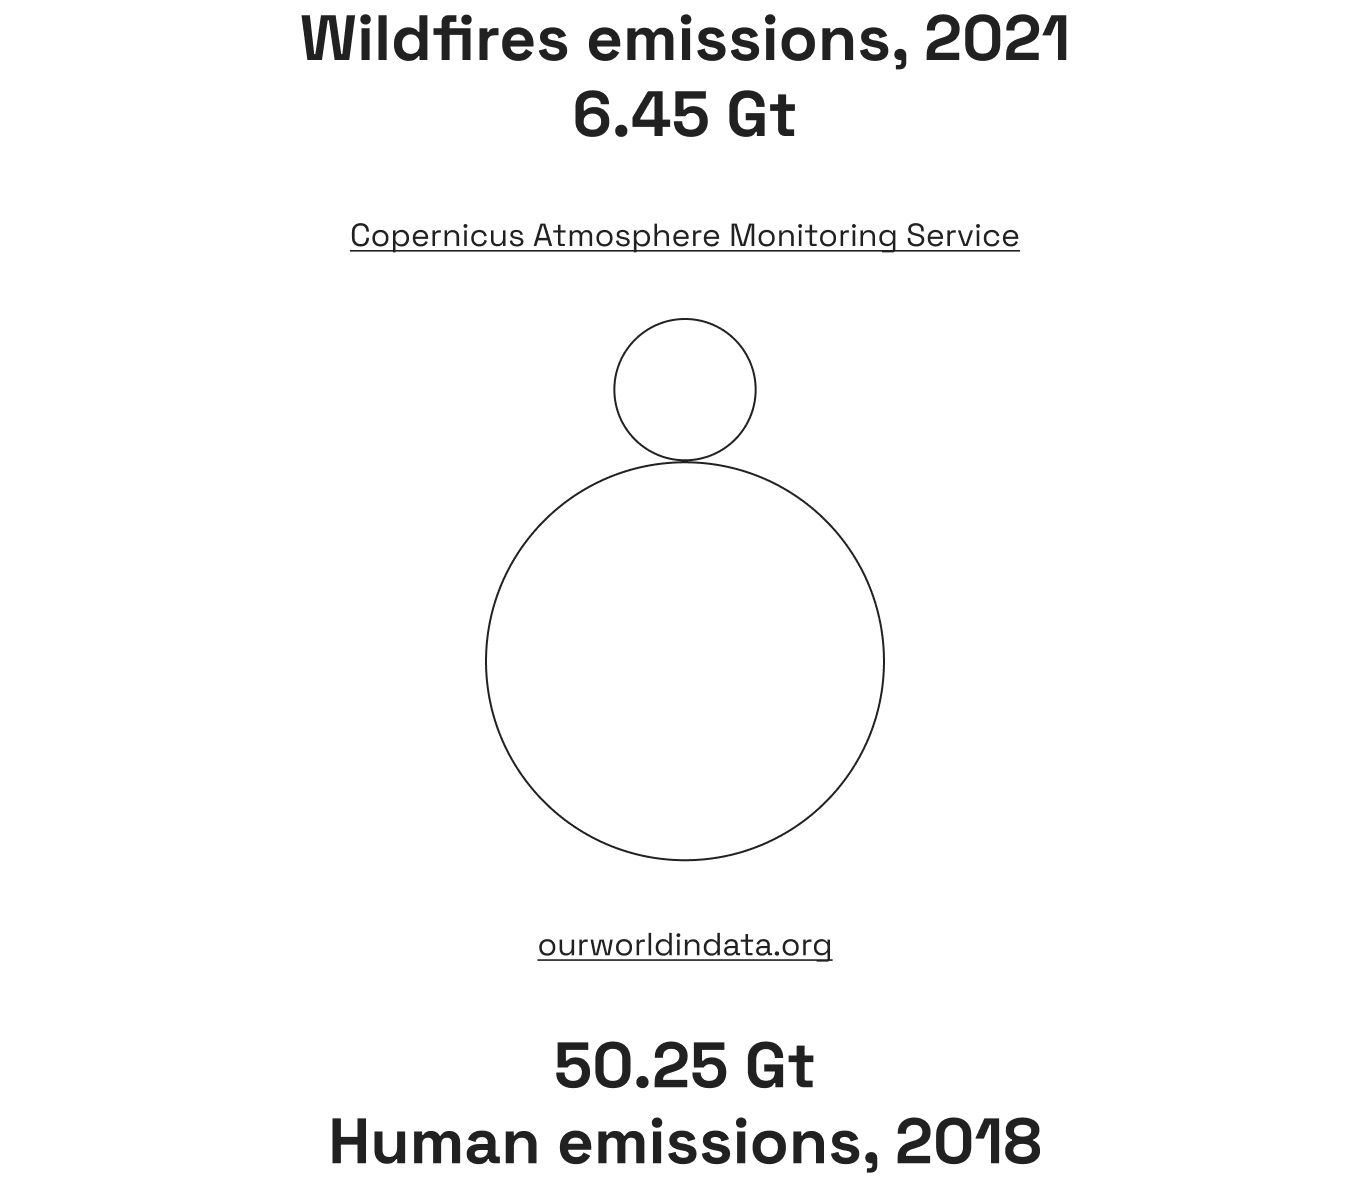
With the images of the 2019–2020 bushfire season in Australia and San Francisco’s orange-coloured skies still fresh in our memory, global wildfires can be a useful comparison to make against human emissions.
Yes, we win again. Summer 2021 was particularly bad – almost twice as bad as 2020 – as estimated by the Copernicus Atmosphere Monitoring Service.
Wildfires globally emitted 6.45 gigatonnes of CO2. That puts us at almost 8:1 over wildfires.
OK, but what about that ☄️ asteroid that killed the dinos?
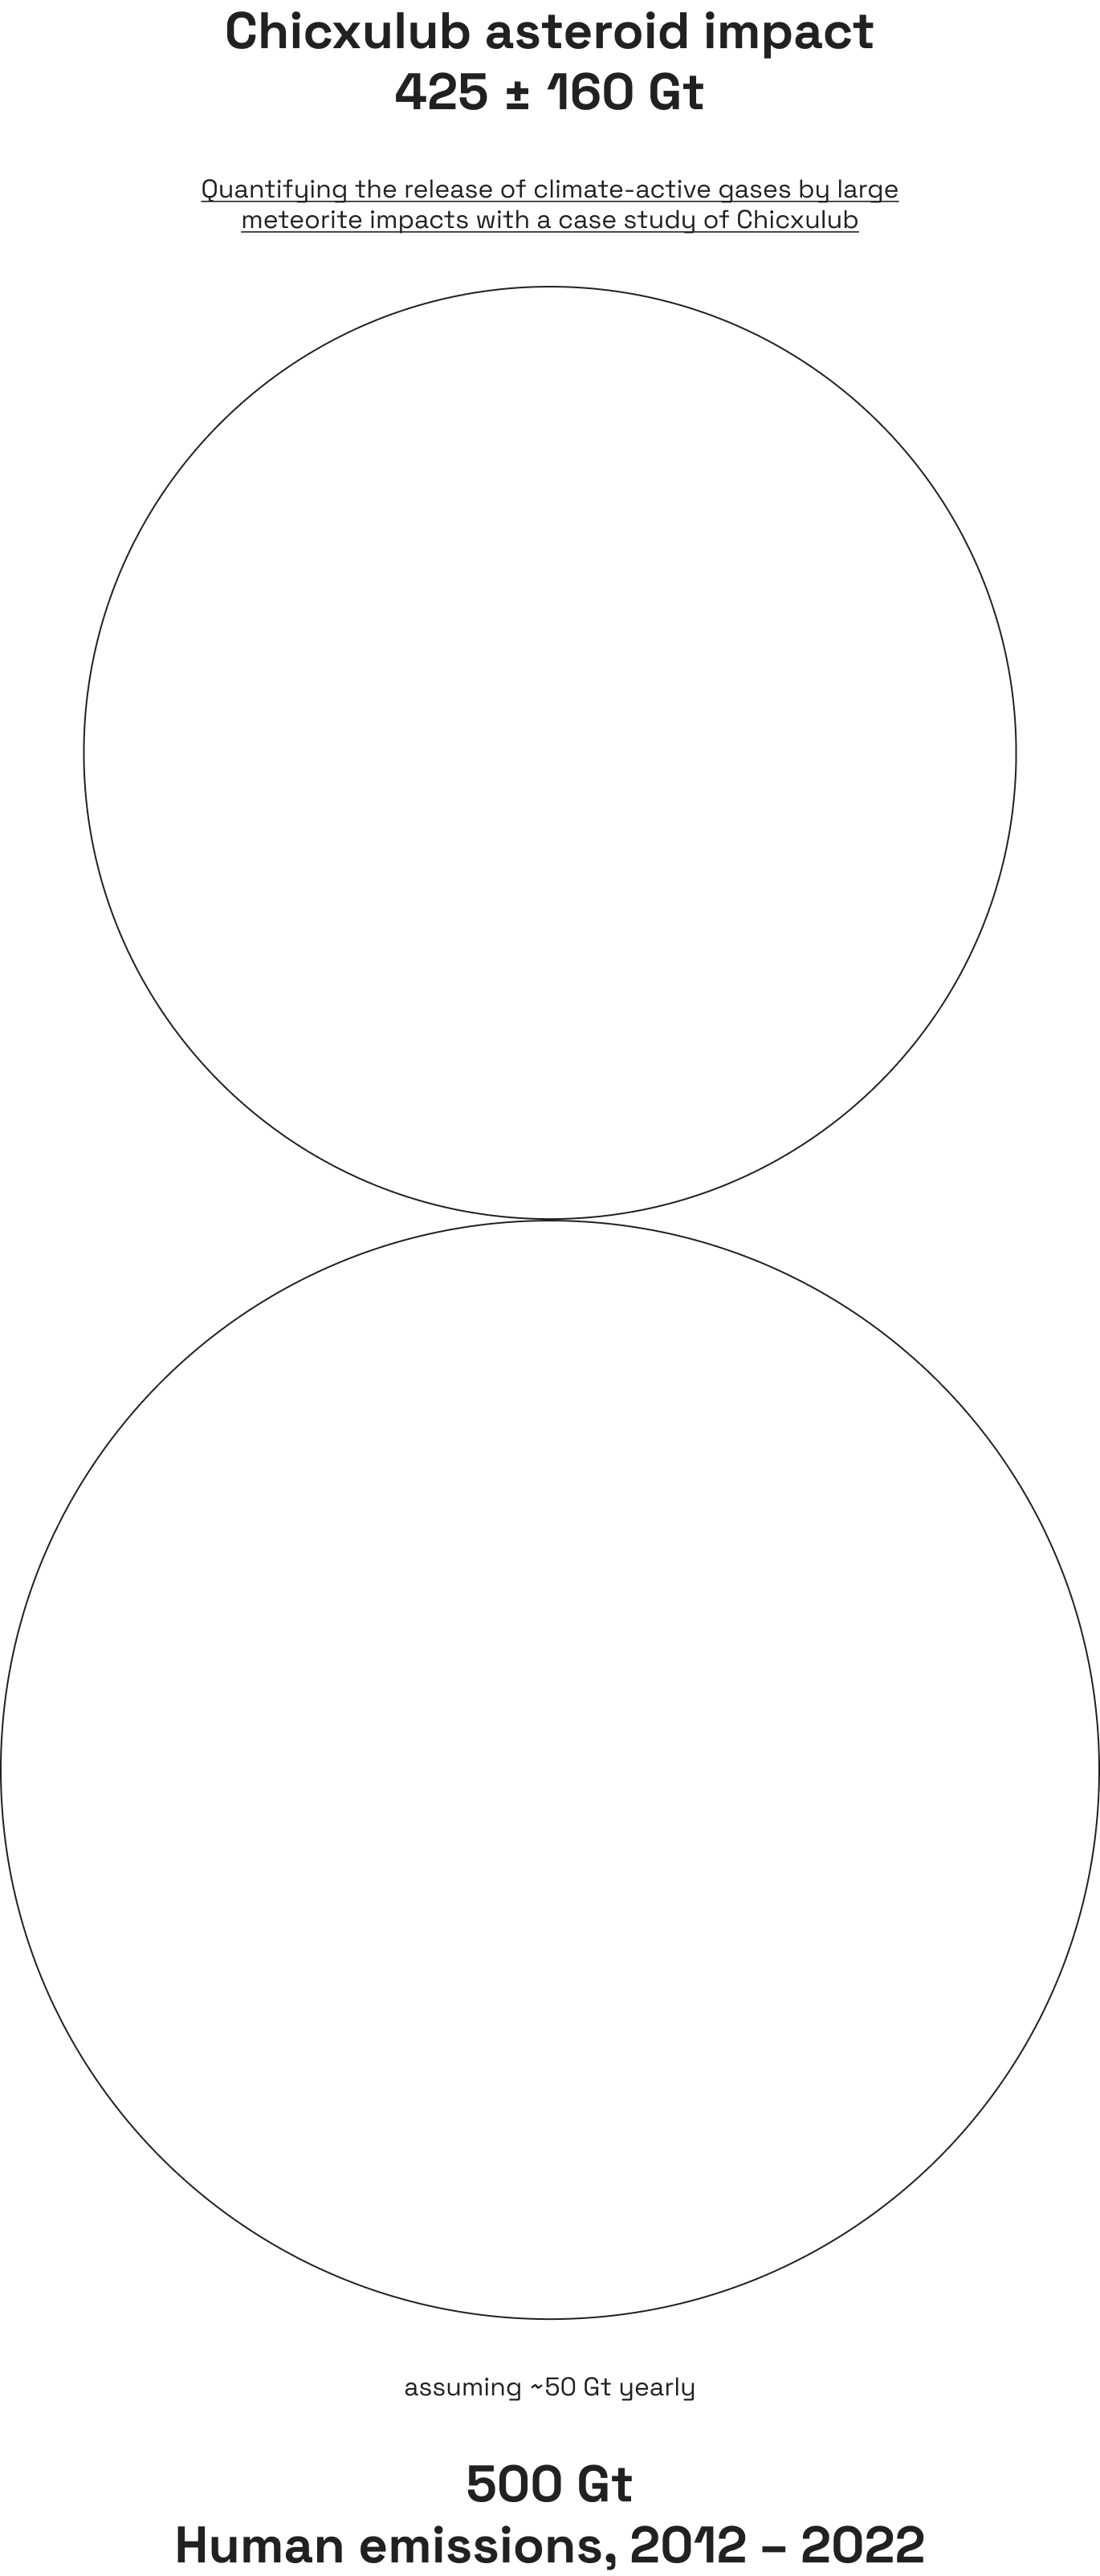
Scientists from the Planetary Science Institute, Tucson, AZ and the Imperial College London have recently (2018) re-estimated the impact of the Chicxulub asteroid on Earth’s atmosphere.
The asteroid that impacted on Earth 66 million years ago, led to the extinction of about 75% of plant and animal species on the planet. This was not so much because of the impact itself – which had local consequences – but rather because of the large amounts of gases it launched into the atmosphere, particularly 425 ± 160 Gt of CO2, which led to global climate changes.
The 425 ± 160 Gt estimated are 8.5:1 compared to human emissions in 2018. But asteroid impacts of that magnitude don’t happen yearly. Our emissions instead pile up over time. In the last 10 years, assuming about 50 Gt of CO2e each year, we’ve emitted more greenhouse gases than the asteroid impact.
⚡️ Energy use to 🚜 land use: human emissions, by sector
We’ve established we produce roughly 50 Gt of CO2e every year, and looked at how that compares against other natural emissions. If we break down human emissions, where do they actually come from?
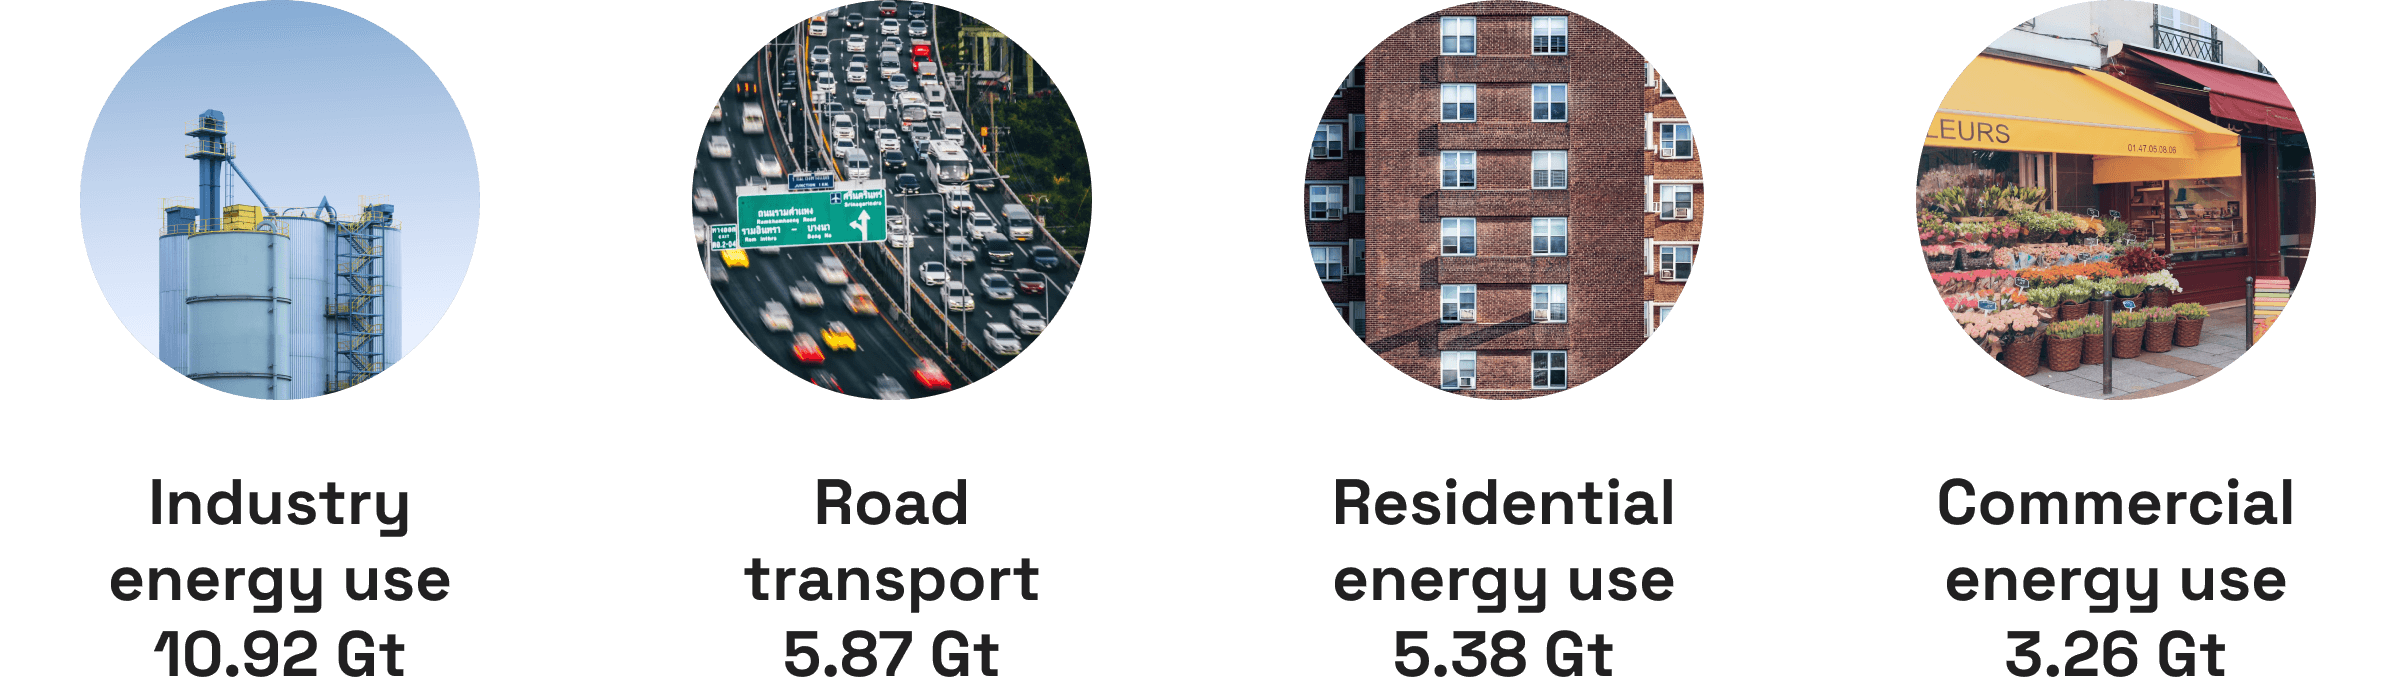
Looking at 2016 data from ourworldindata.org, the top contenders in emissions production are all in the energy sector, except for road transport:
- 10.92 Gt from energy used in industries (including iron, steel, chemical and petrochemical)
- 5.38 Gt from energy used at home (for heating, cooling, cooking and lighting)
- 3.26 Gt from energy used in commercial buildings (offices, restaurants, shops).
This is because we still use a lot of fossil fuels to produce the energy we use in our industries, in our shops and at home.
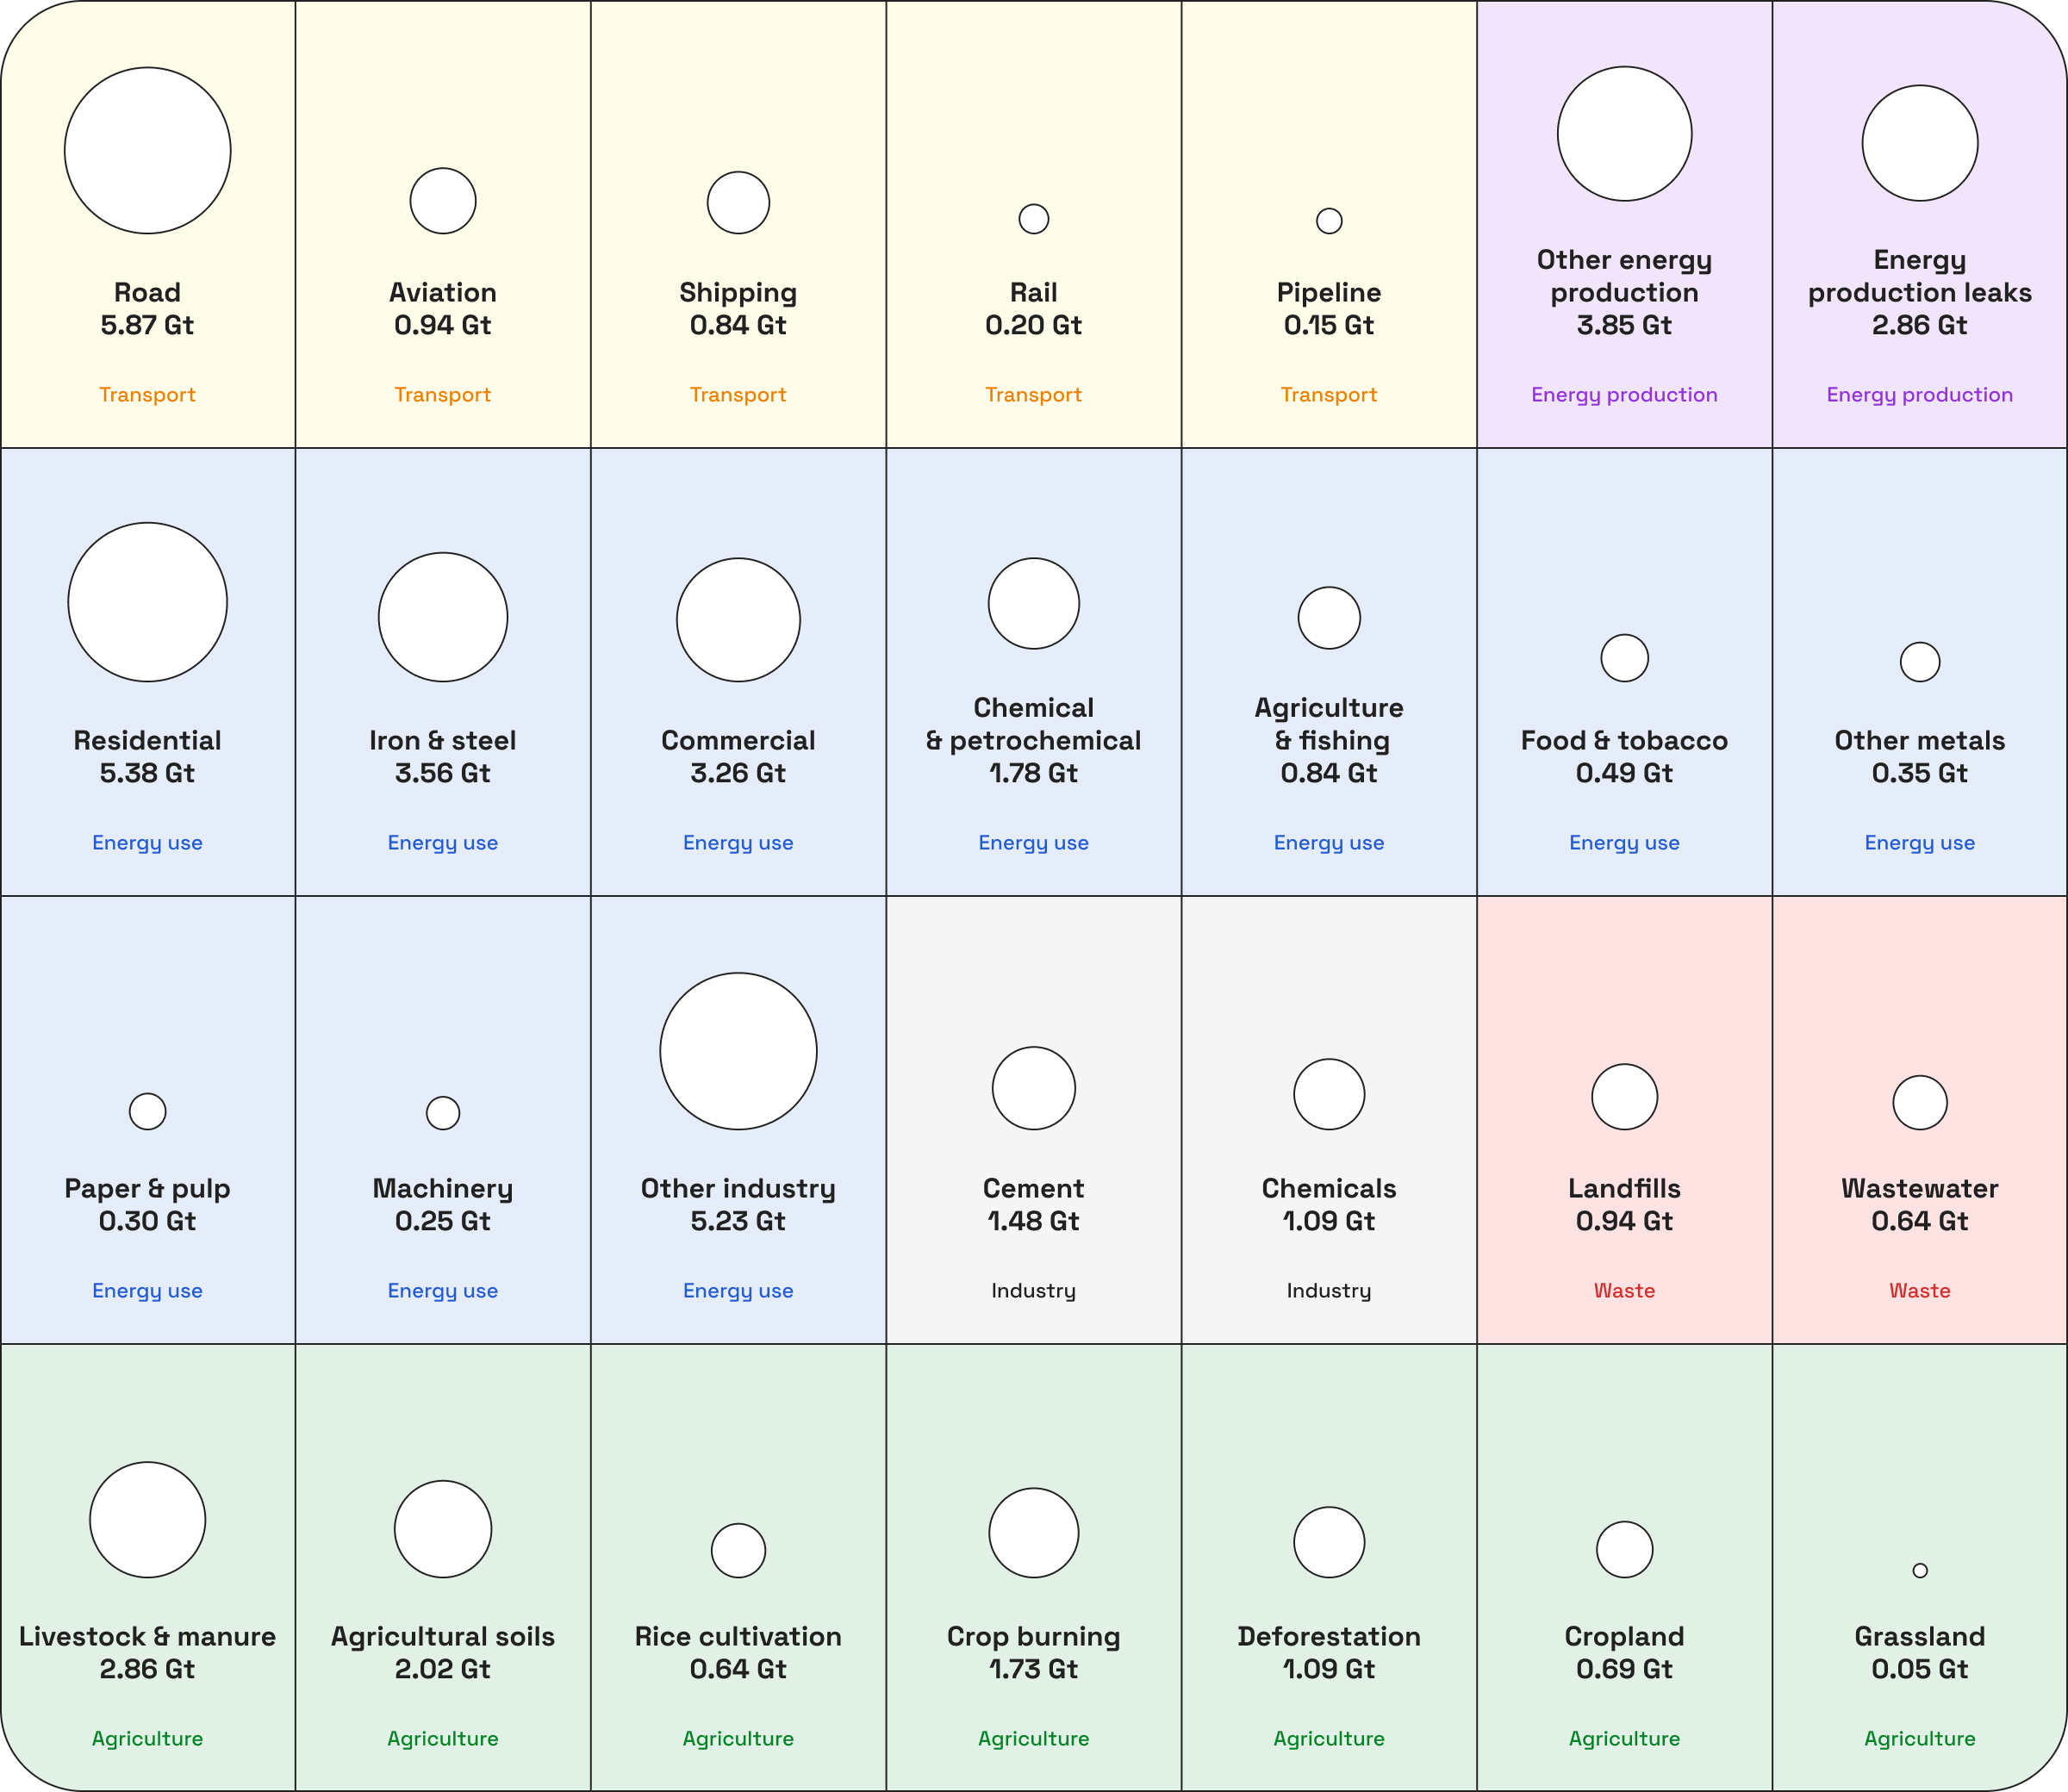
Road transport alone emits 5.87 Gt of CO2e:
- 60% from passenger travel (cars, motorcycles and buses)
- 40% from road freight
Below is a comprehensive table showing emissions broken down by sector, highlighting the magnitude of each individual area.
Beef 🐮 to bananas 🍌: how much CO2 per kg of food?
Using data from Carbon Cloud, we looked at the emissions generated when getting a variety of foods to our tables. These numbers are for the production of 1kg of food (e.g. 1kg of strawberries) and its delivery to shops in the UK.
There are a 5 main factors that impact the emissions generated:
- Agriculture (soil, manure, rumination, fuel use in machinery, fertilisers)
- Processing (fuel and chemicals used to process foods)
- Transport (planes and lorries emit a lot compared to more efficient trains and cargo)
- Storage (lighting, heating, refrigeration and ventilation)
- Packaging (energy and resources to package food)
When assessing how much a particular food item might impact, think of these 5 variables:
- How much land does it use?
- How long does it take to grow?
- How much processing does it require?
- How far does it have to travel, and using which transport method?
- Does it stay stored for long?
- What resources and energy does the packaging require?
In general, agriculture and processing are by far where the bulk of the emissions come from.
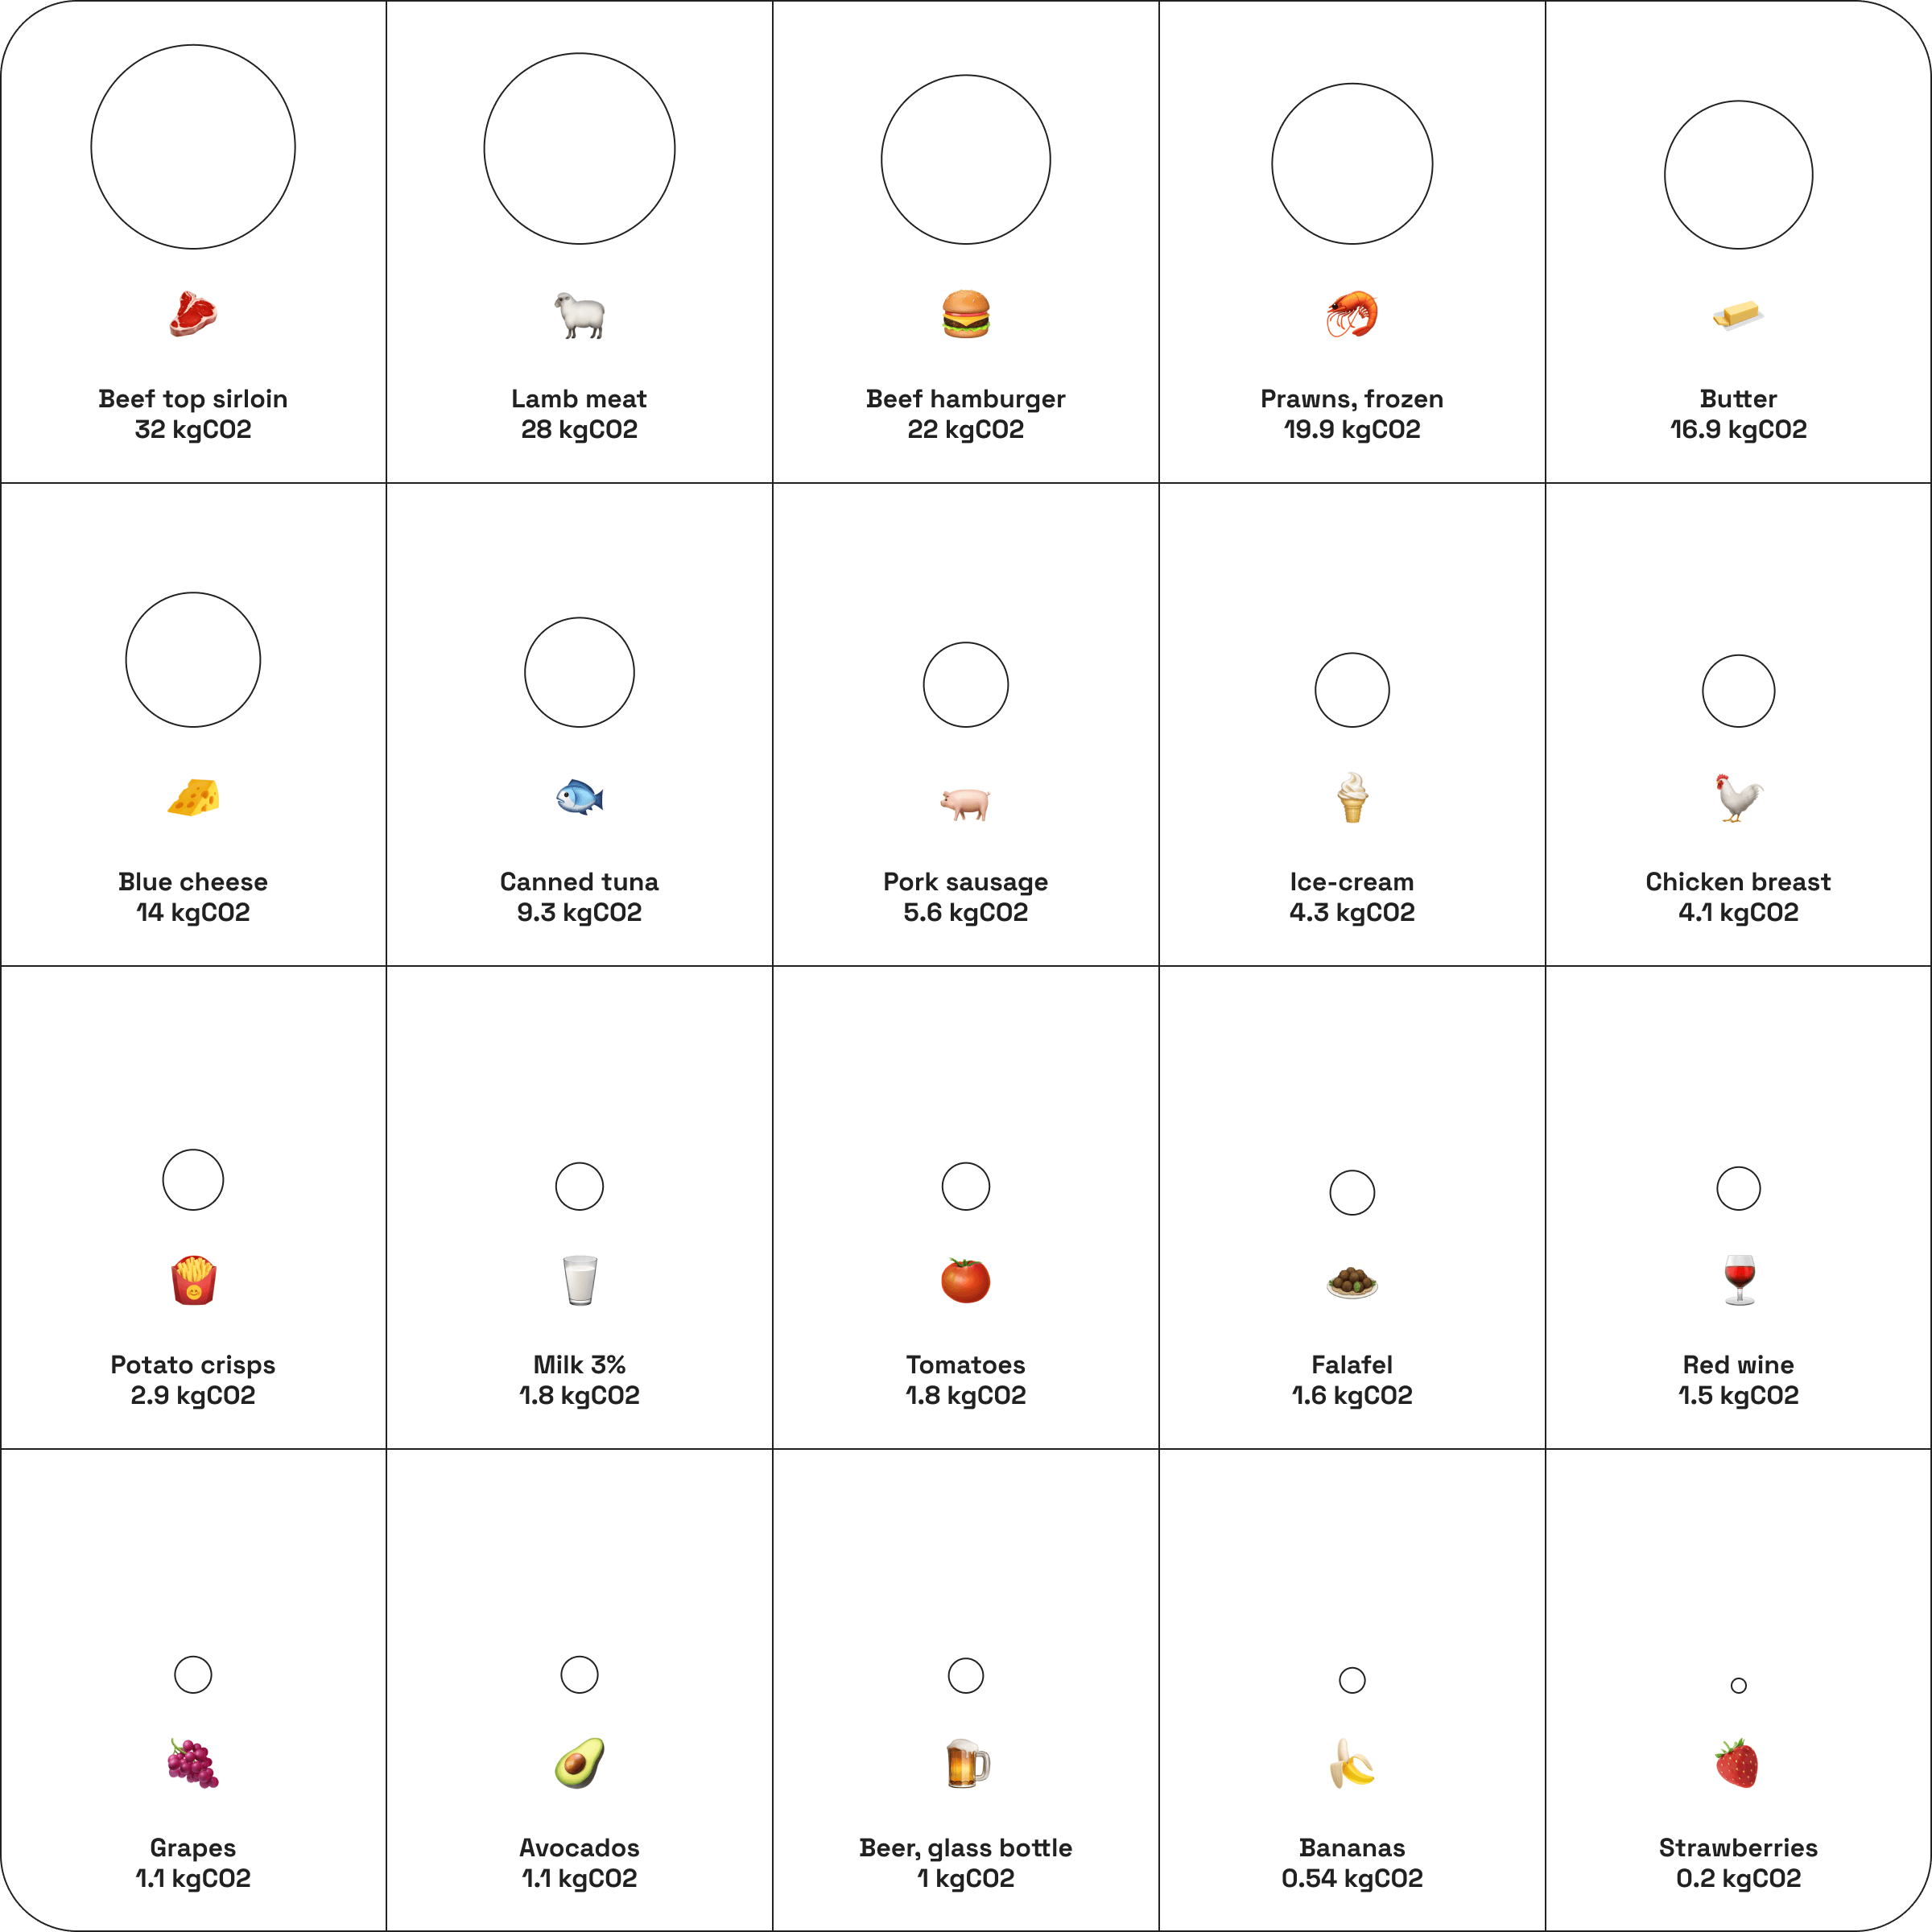
Here’s a couple takeaways:
- 8kg of chicken emits as much as 1kg of beef.
- Anything involving cows has a high footprint because of how much land they require, the methane they emit when ruminating and the manure they produce.
- Diets heavy on vegetables are much less impactful than those rich in meats.
Flying ✈️ to ferrying ⛴: how much CO2 per km travelled?
According to data from ourworldindata.org this is how much CO2 different transportation methods emit per kilometer (0.62 miles) travelled.
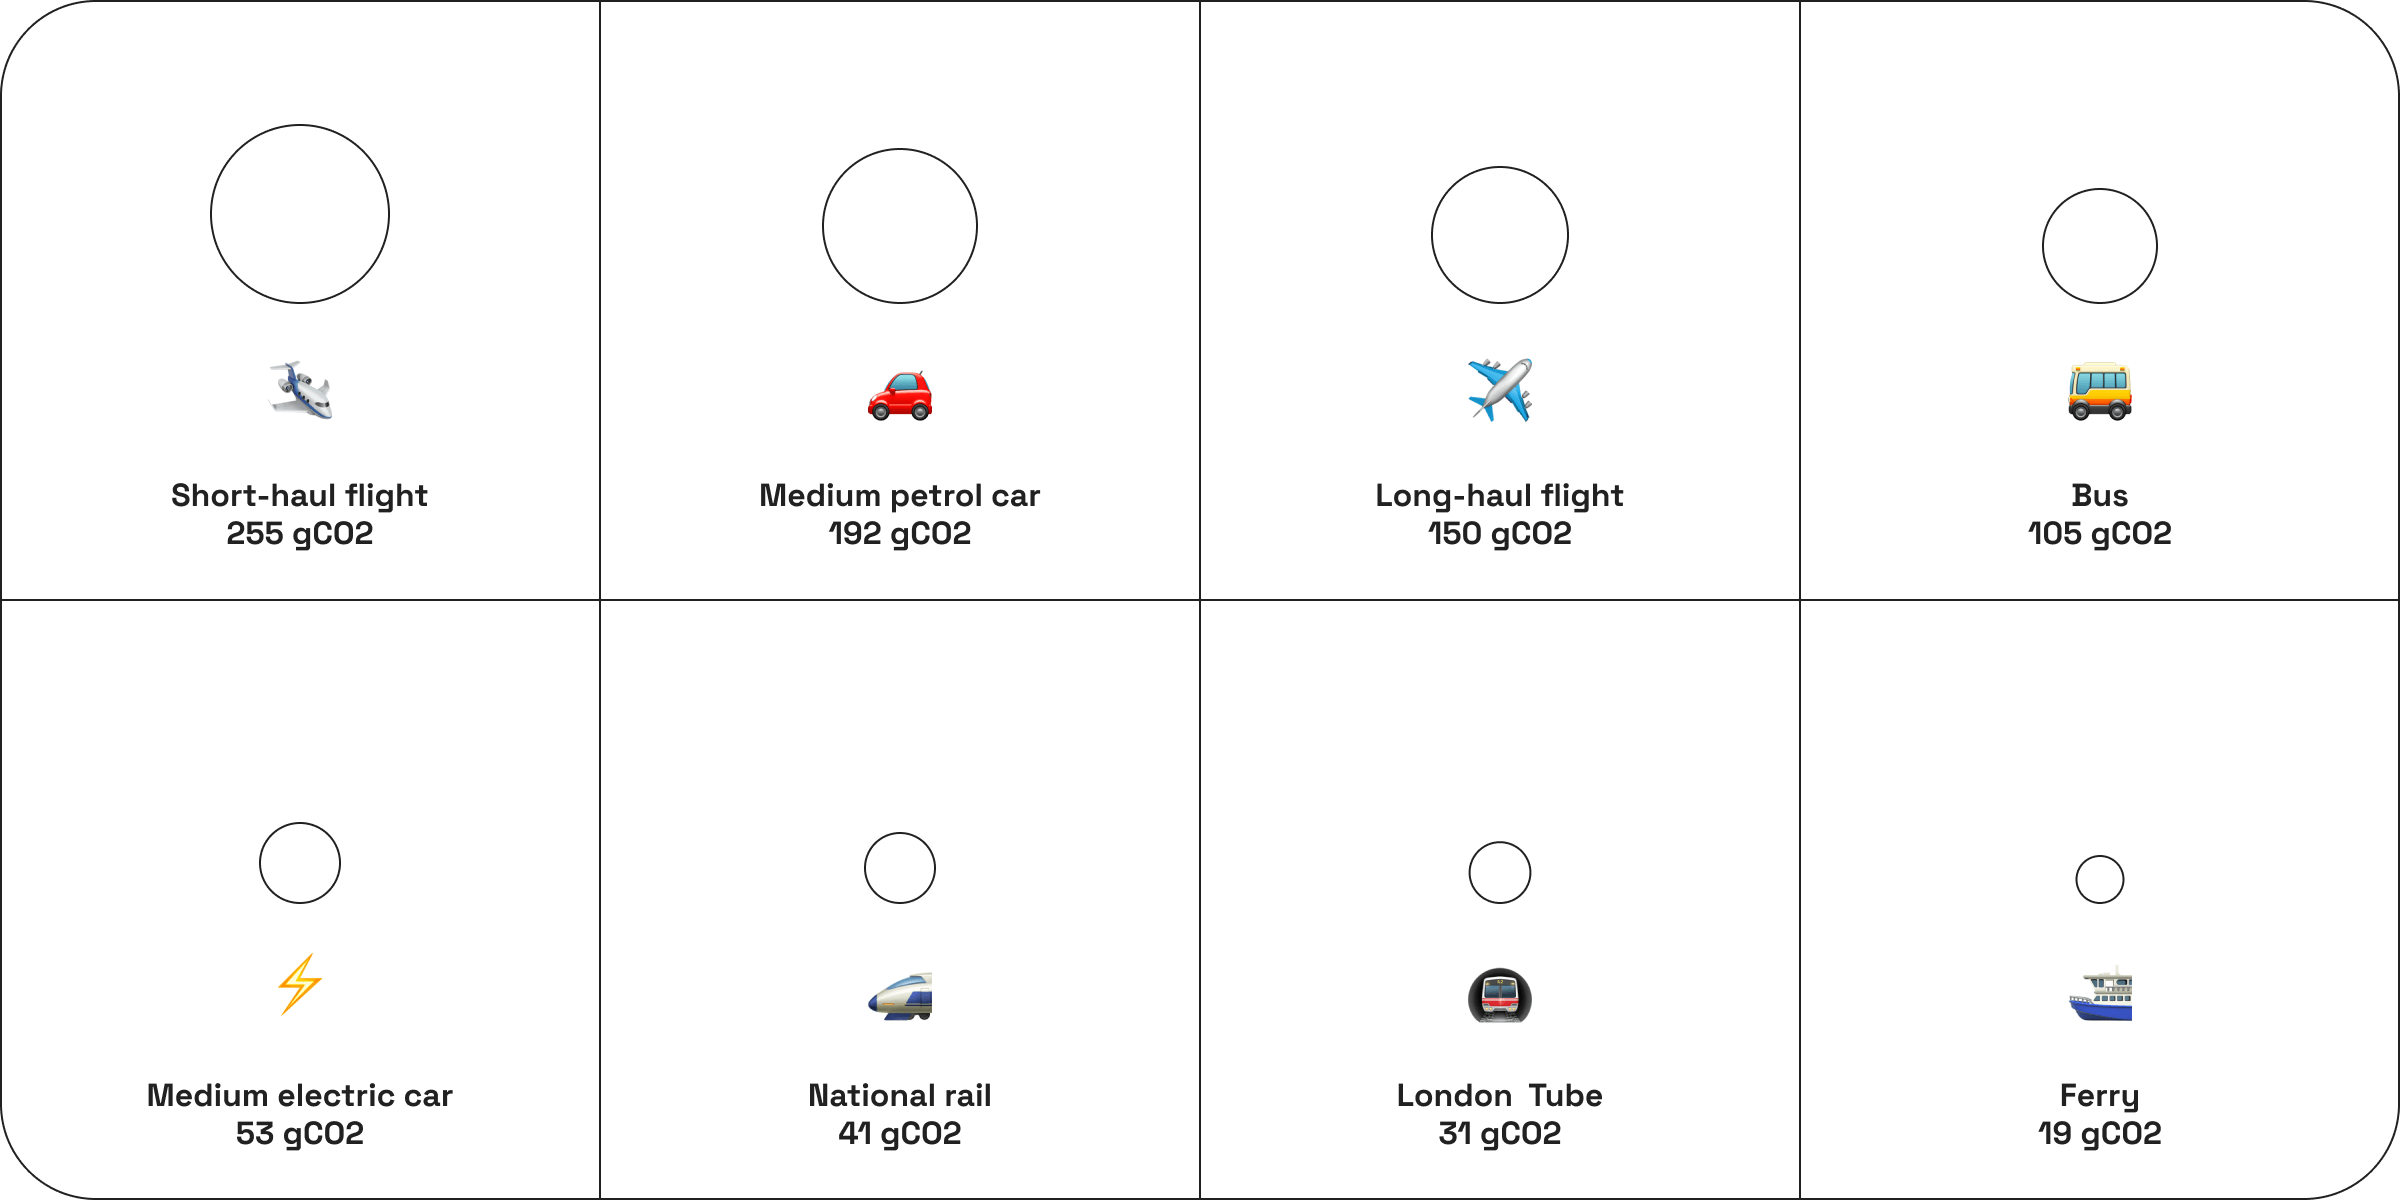
Here’s a couple takeaways:
- Long-haul flights are less polluting than short ones, because take-off is the most polluting phase, meaning that a long-haul flight will optimise the emissions per km with the longer, less polluting, cruise phase
- The emissions of electric vehicles depend on the energy mix used to resupply. The numbers shown above refer to the average energy mix in the UK, but refuelling using only renewables will reduce that, while refuelling using a mix heavy in fossil fuels will bring those emissions up.
- Petrol driving emissions are comparable to those of flying, depending on the length of the flight.
Wrapping up
Yes, we emit a lot.
We dwarf even mighty natural sources like volcanoes, wildfires and asteroids slamming onto Earth. We do so across human activities, there’s no single thing we produce or do that is alone responsible for it.
However, being aware of what emits more, being able to visualise it, can help us make the climate cost of our activities visible.
This climate cost has so far been obfuscated from our view, making it hard for us to account for it when making decisions. Knowing the difference in impact can steer our decisions in what we buy, how we buy it and nudge the global economy away from options that we can no longer sustain.
🌍
Popular insights
Popular insights