















Your logistics emissions, ready to report
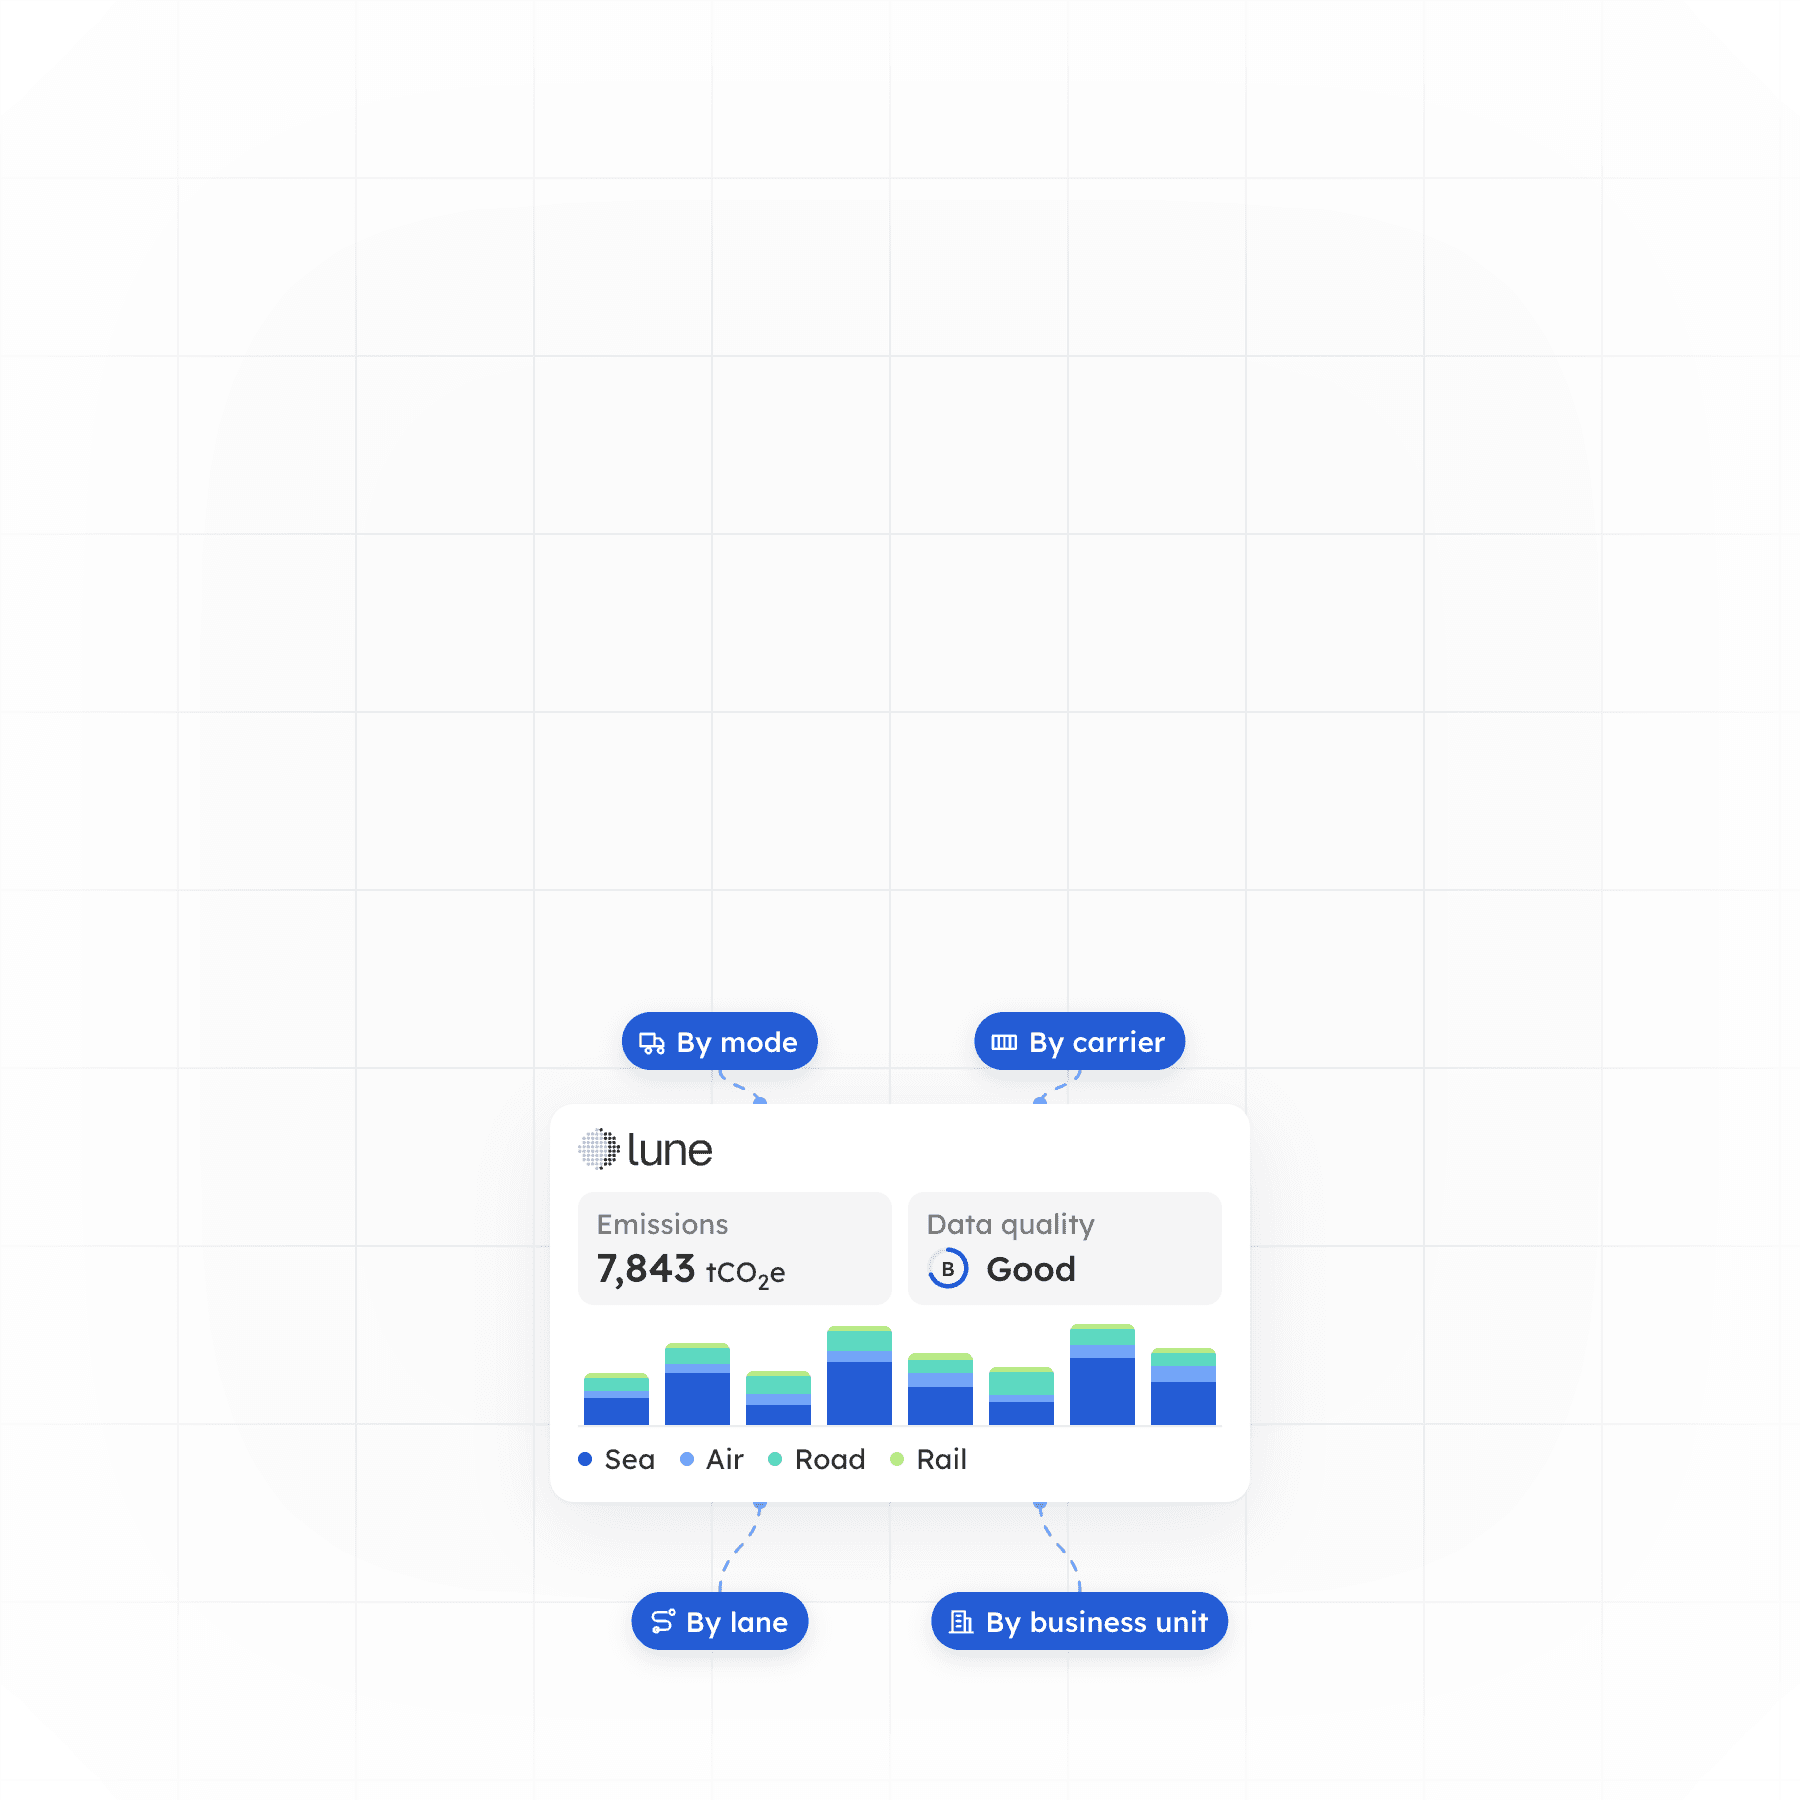
See your CO₂ by mode, carrier, lane and business unit, with the sources and step-by-step explanations your auditor will ask for. Then use the same data for CSRD, Scope 3, climate targets or a customer request.
Your logistics emissions, ready to report
See your CO₂ by mode, carrier, lane and business unit, with the sources and step-by-step explanations your auditor will ask for. Then use the same data for CSRD, Scope 3, climate targets or a customer request.
Your logistics emissions, ready to report
See your CO₂ by mode, carrier, lane and business unit, with the sources and step-by-step explanations your auditor will ask for. Then use the same data for CSRD, Scope 3, climate targets or a customer request.
Your logistics emissions, ready to report
See your CO₂ by mode, carrier, lane and business unit, with the sources and step-by-step explanations your auditor will ask for. Then use the same data for CSRD, Scope 3, climate targets or a customer request.
Trusted by 100+ companies











Live emissions KPIs
Shipments, CO₂e, distance and data quality, updated as new data arrives.
Live emissions KPIs
Shipments, CO₂e, distance and data quality, updated as new data arrives.

Breakdowns that find hotspots
By mode, carrier, lane, business unit and well-to-wheel stage.
Breakdowns that find hotspots
By mode, carrier, lane, business unit and well-to-wheel stage.

Reports you describe
Ask for the view you need and Lune builds it.
Reports you describe
Ask for the view you need and Lune builds it.

Per-customer reporting
Logistics providers report for every customer automatically.
Per-customer reporting
Logistics providers report for every customer automatically.
Your emissions KPIs, live
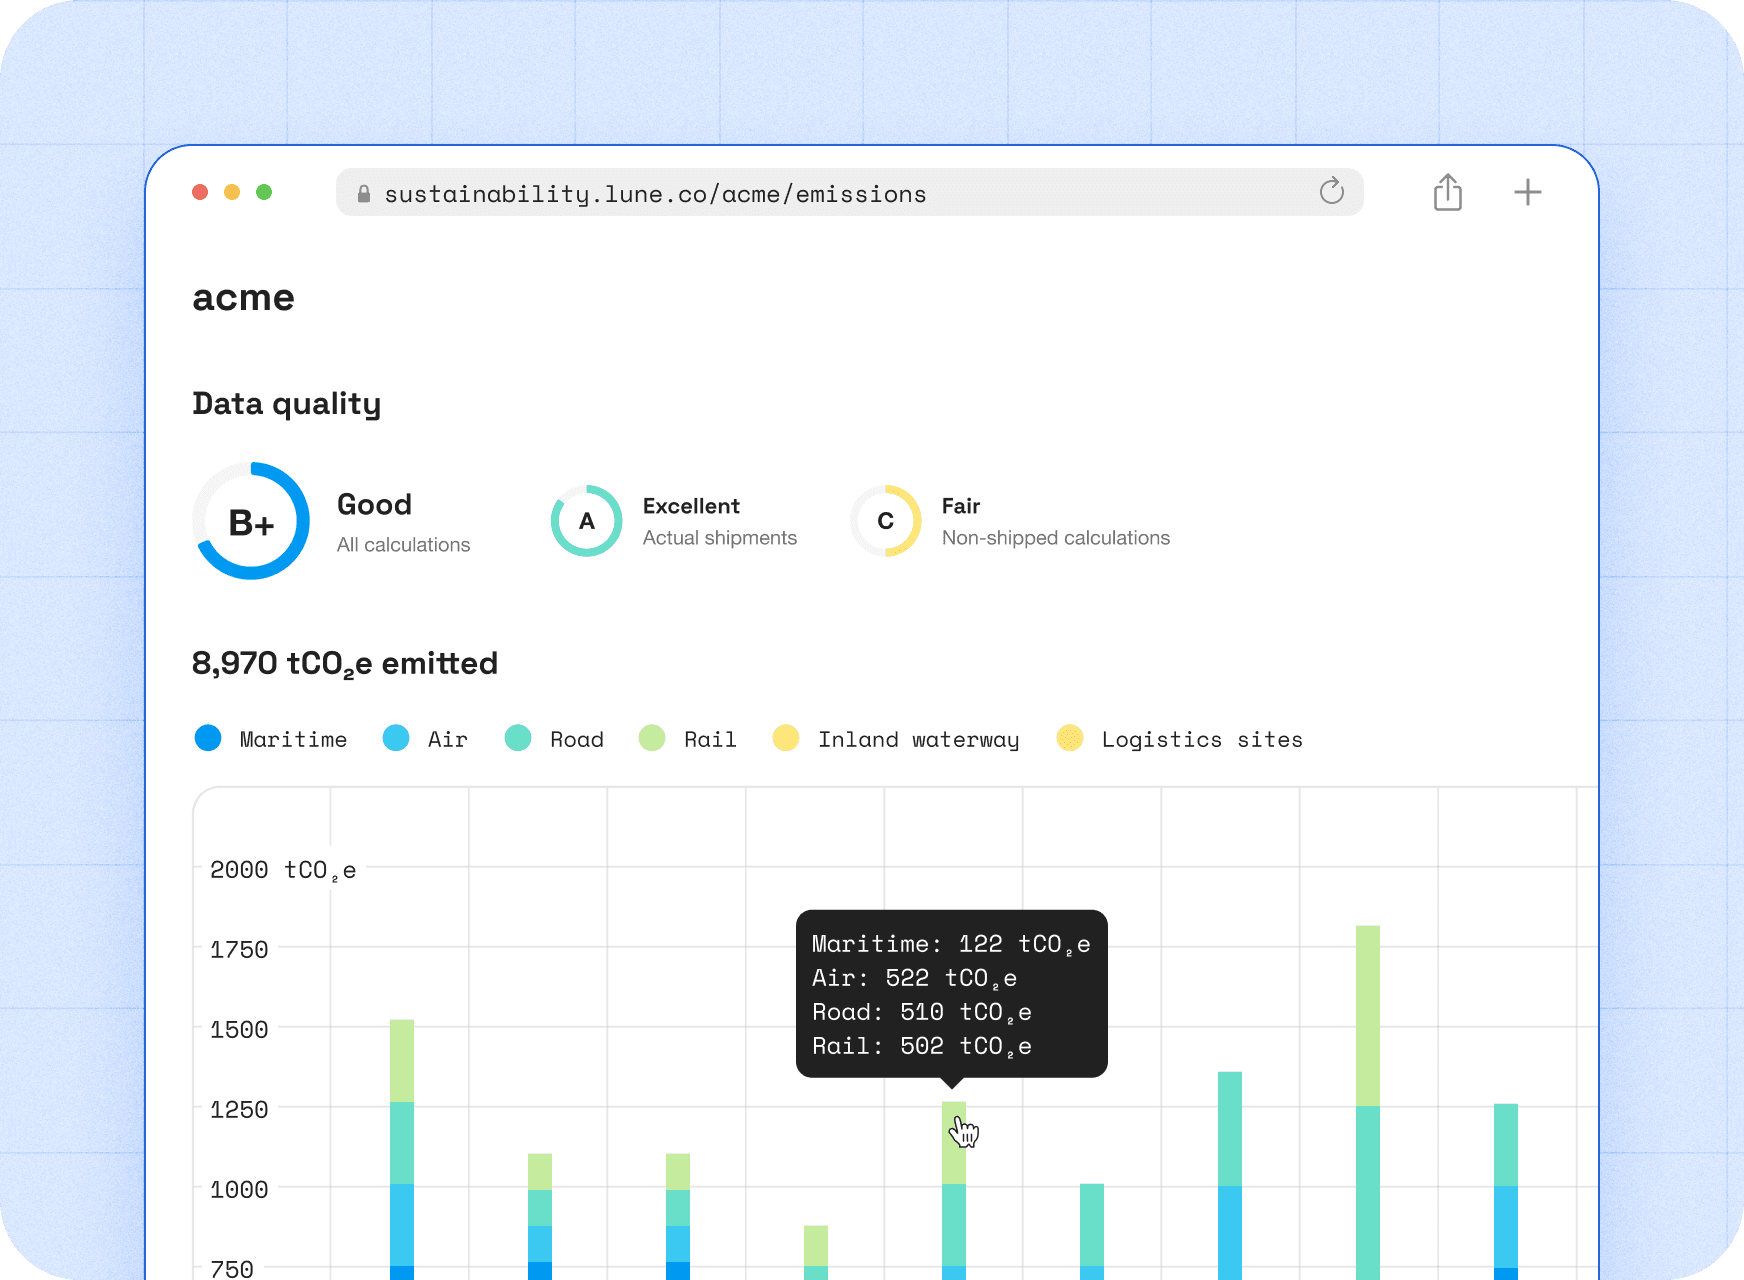
Track total shipments, CO₂e, distance and overall data quality in one cockpit. Follow emissions and emissions intensity over time, split by transport mode or by well-to-tank and tank-to-wheel, and see progress against your decarbonisation goals.
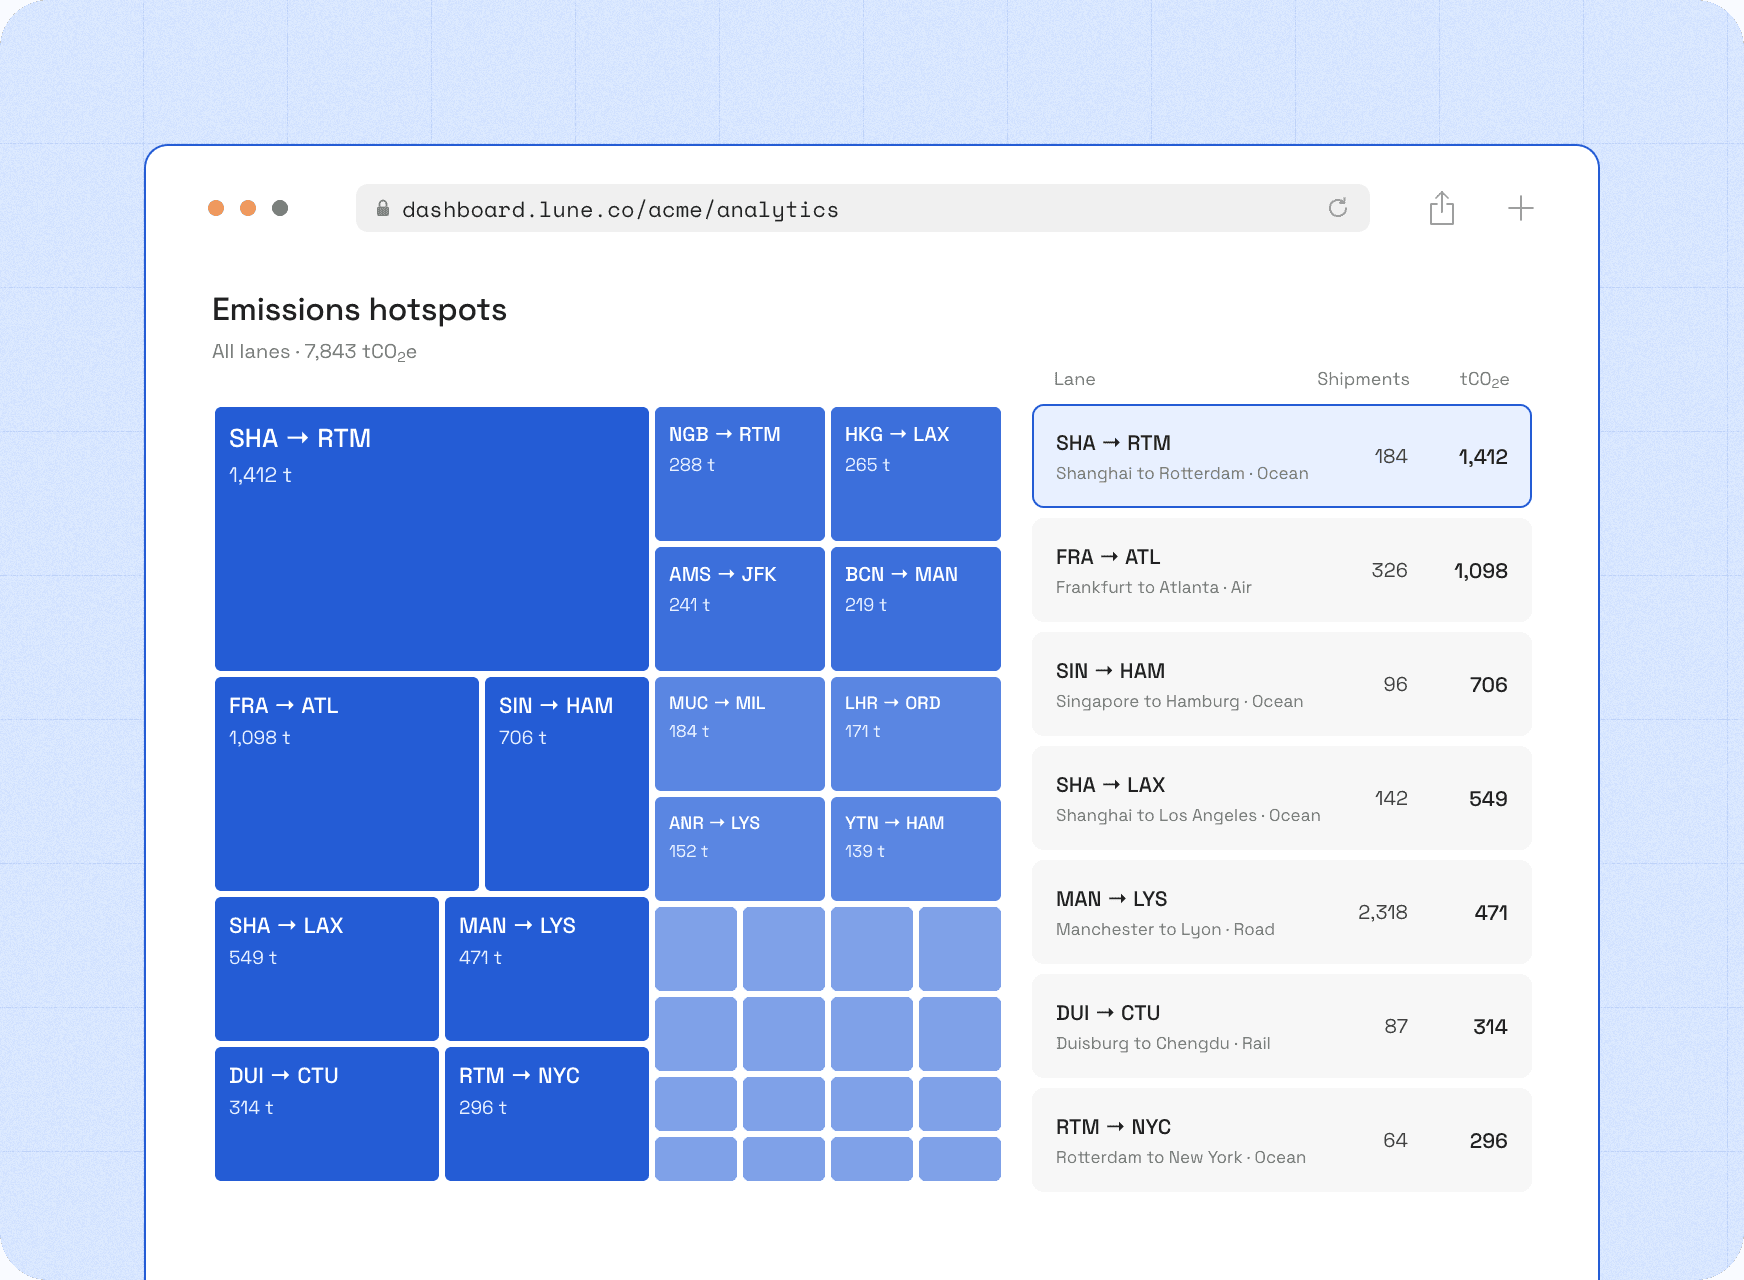
Find your emissions hotspots
Drill into the lanes, port pairs and carriers that drive your footprint. Knowing that one trade lane or one carrier accounts for a large share of emissions turns reporting into a starting point for reduction.
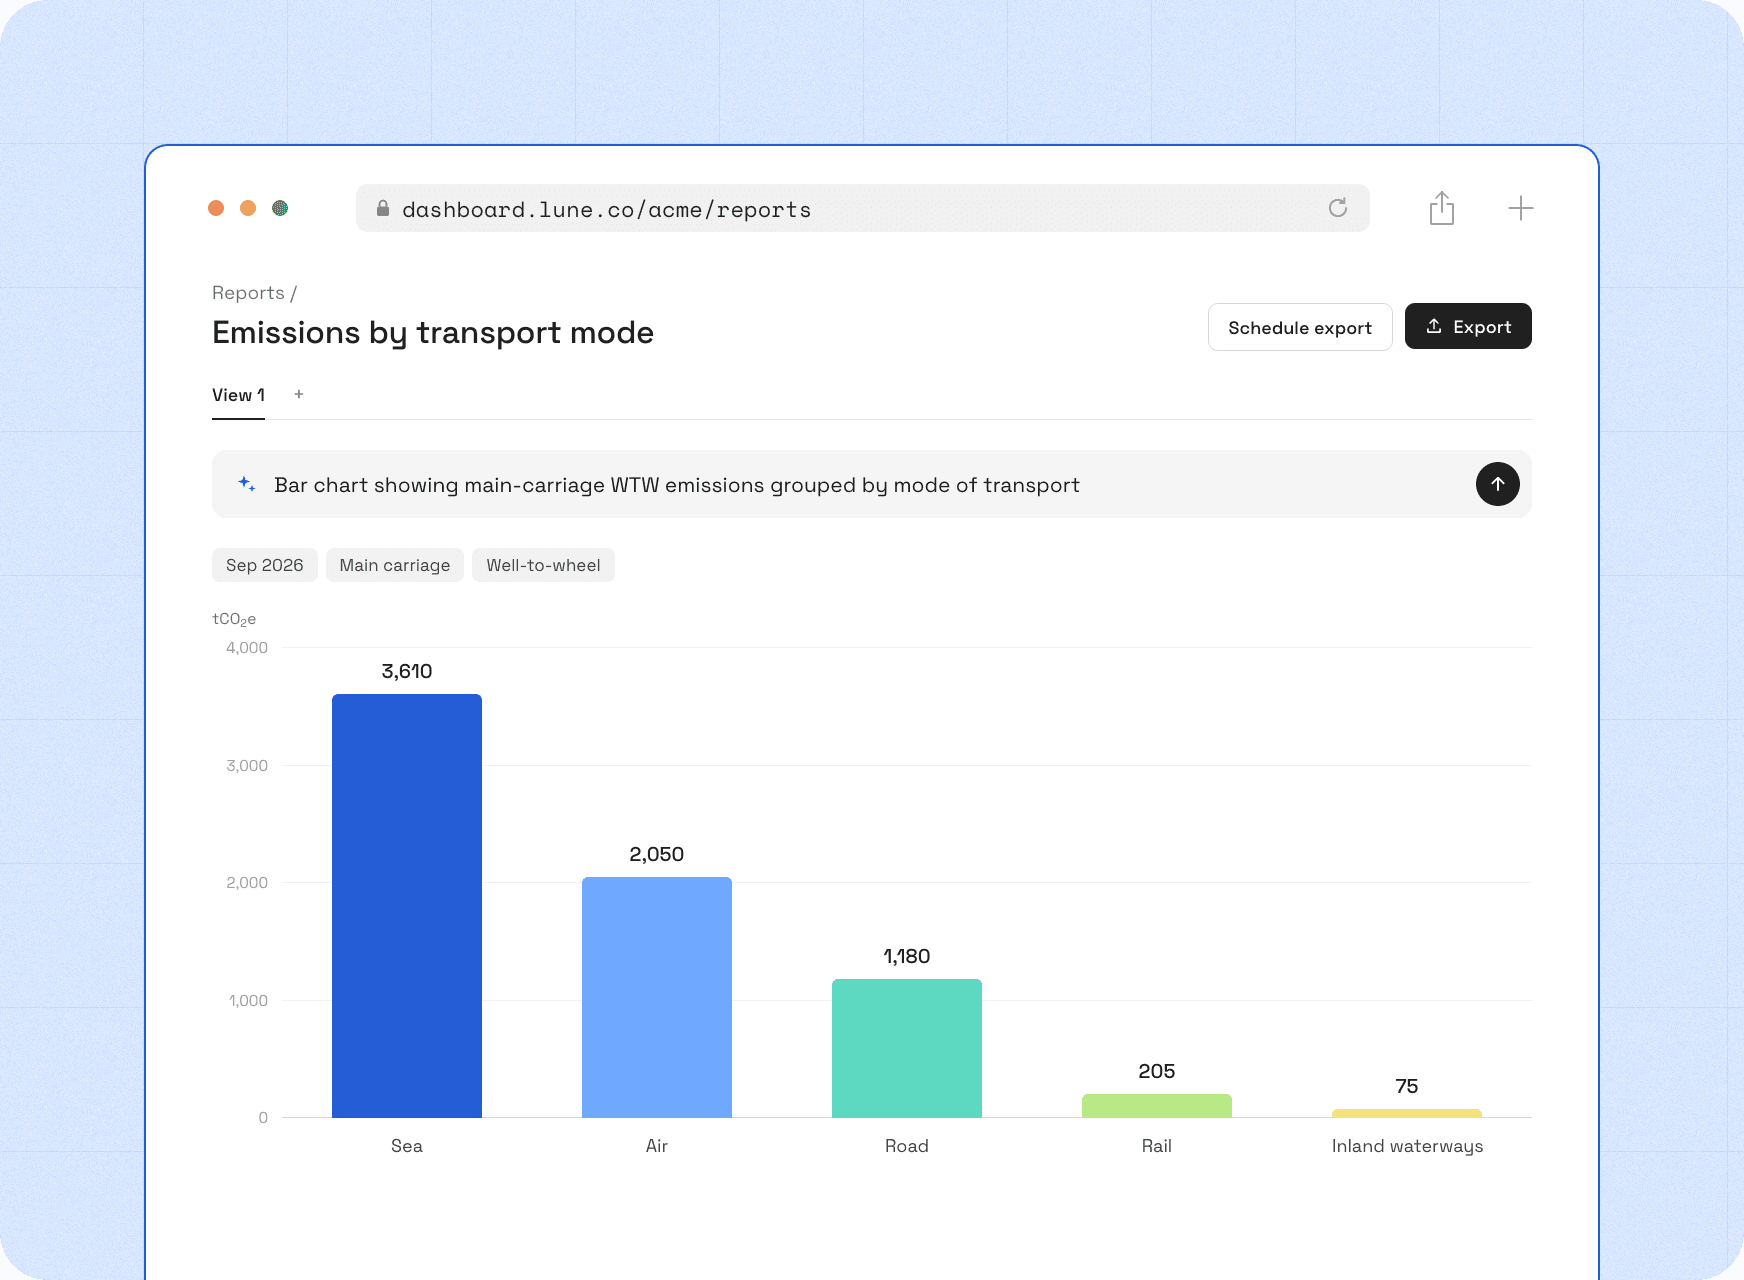
Reports, built by describing them
Describe the report you need, for example main-carriage well-to-wheel emissions by mode of transport, or total weight by consignor, and Lune builds the table or chart. Filter, group, export, or schedule exports to arrive automatically.
Every report, traceable to its source
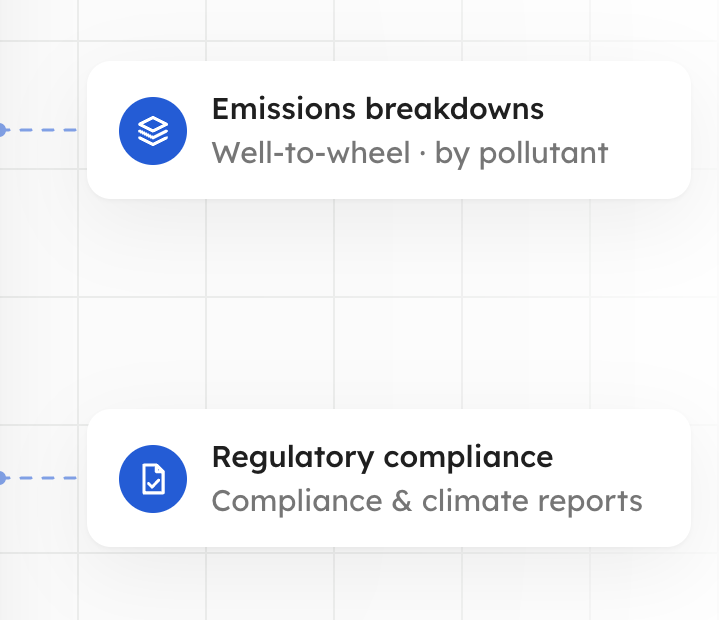
Every figure comes with step-by-step explanations, sources and a data quality score, so auditors can see exactly how it was reached. Use the same data for CSRD, GHG Protocol Scope 3, climate targets or a customer request.




30+ freight forwarders winning tenders using Logixboard's CO₂ emissions reporting tool
Lune was the best partner for translating detailed information into something understandable. Instead of just presenting all of the data and hoping someone can make sense of it, the Lune team knew how to curate the data and make it understandable to people.

Erin Miska
Product Marketing Manager at Logixboard30+ paying customers
1,100,000+ shipments

FAQs
What do I get out of the box?
What do I get out of the box?
Can I use the data for CSRD?
Can I use the data for CSRD?
Can reports be customised?
Can reports be customised?
Can I report for each of my customers?
Can I report for each of my customers?

From shipment data to report in one place.