
At Lune, we’re focused on providing the most accurate emission calculations possible. Earlier this year, we took a close look at how the Red Sea crisis was affecting our emission calculations. We promptly made some changes to how we estimate sea shipment emissions. Specifically, we've improved our ability to accurately estimate sea distance, even when shipments are diverted.
As the inaugural blog in our new series "Lifting the Lid", we want to share how we've made use of vessel tracking data to deliver the most accurate emission calculations on the market.
 Shipment distance is key to calculate carbon emissions
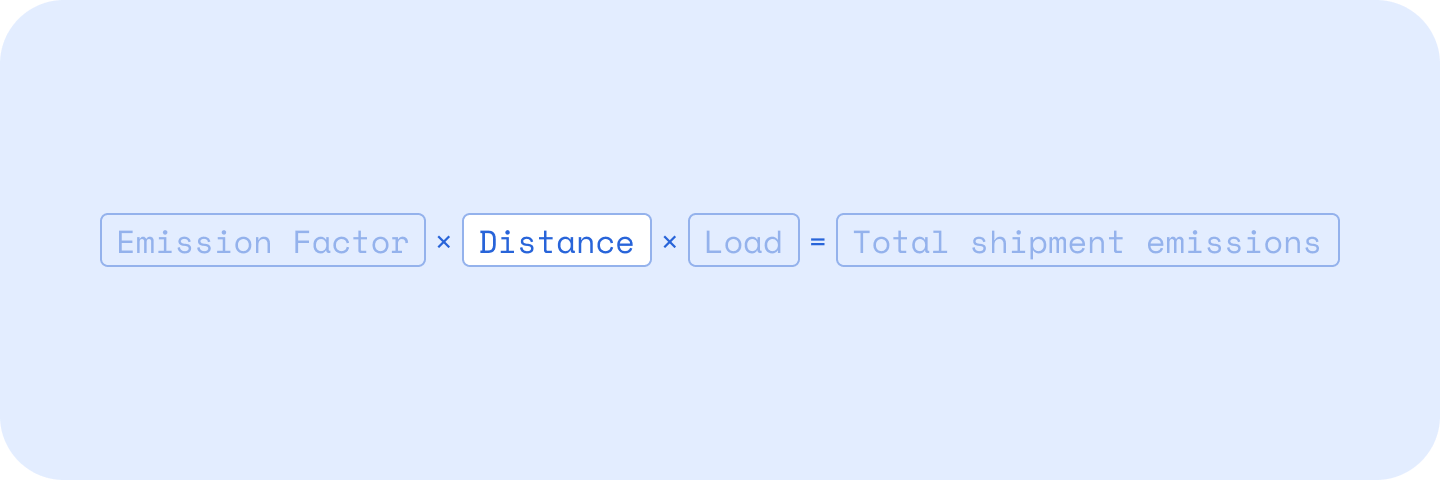
When it comes to calculating carbon emissions for sea shipments, a key component is identifying the distance a sea vessel travels.
To do this, we have two options:
- Estimate the distance travelled using a sea distance algorithm
- Track the vessel, calculate distance based on the vessel’s true route
Why bother with vessel tracking?
It’s true that sea distance estimation can be incredibly accurate; ships travel along well defined routes and trade lanes. Their predictable behaviour has informed many sea distance algorithms, including our own proprietary algorithm at Lune. These algorithms provide us with something close to the shortest feasible distance between ports, while taking historic, real-world data into account. So if estimation is so good, why bother with vessel tracking?
As ships round the Cape of Good Hope to avoid the conflict in the Red Sea, we are reminded how quickly things can change. Prediction works well, if the future looks like the past, but more and more, we witness how disruptions can have cascading effects across the whole industry. It’s important that emission calculations can adapt.
Enter vessel tracking. Using AIS (Automatic Identification System) data, we are able track a vessel on its journey from Port A to Port B. This gives us visibility into the true route of the vessel, but most importantly, we can see all the stops, turns, and unpredictable behaviour a ship partakes in along the way. AIS tracking brings accuracy to a whole new level, even when ships follow their usual route.
What is AIS data?
AIS (Automatic Identification System) was developed in the 1990’s as a navigation safety tool. It allows ships to continuously transmit their position, speed, heading, etc., making them visible to other ships in the area. From the shore, AIS transponders receive data from passing ships.
Many companies with an interest in collecting AIS data, put up towers to collect and store the data. By collecting data from a large number of towers (Terrestrial-AIS), and satellites (Satellite-AIS) globally, one can piece together the route of a ship with extreme granularity.
Step 1: Finding an AIS data provider
We learned quickly that there are many providers of AIS data. These are some of the guiding questions which helped to narrow our search for a provider.
1. Where do we need coverage?
- We were excited to find that free resources like AISHub and AISstream.io exist, however, we found that their coverage is currently a bit limited.
- We decided to prioritise paid providers with robust global coverage.
2. How might we access the data?
- Many providers distinguish between "live" or recent data, and "historic" data. It's common to see providers host these data in separate products.
- For example, live data may be provided via a live data stream, and historic by an API.
- We were most interested in API's that could provide fast access to small amounts of data (one vessel for a few days).
3. What kind of granularity do we need?
- Some providers downsample their historic data for storage optimisation purposes.
- We preferred to work with a provider that could guarantee us maximum granularity (every few minutes, where possible).
4. Do we need Satellite-AIS data
- AIS transponders are only able to pick up signals from within ~40 nm of the shore. When ships travel across the open ocean, we lose coverage unless we also rely on Satellite AIS data.
- We ran internal experiments to verify the need for satellite data (it's expensive).
- For the level of accuracy we are looking for, we determined satellite data is important.
After testing a number of providers (MarineTraffic, OrbitSailor, OrbComm, Spire, and Datalastic to name a few) we came to a decision. Spire provides the best AIS satellite coverage on the market. They have a range of products that allow us to access both live and historic data, and provide great customer support. We decided to partner with Spire to provide our customers with the most accuracy possible.
An honourable mention
We relied on Datalastic heavily for early stages of testing and brainstorming. They have excellent global terrestrial coverage, clear documentation, and allow you to start a low cost trial online. If satellite data isn't a requirement for you, Datalastic has a really excellent service.
 We decided to partner with Spire to provide our customers with the most accuracy possible
Step 2: Implementation
After deciding to partner with Spire, we spent some time brainstorming how we might use their data to better inform our emission calculations.
Given a list of coordinates where a vessel was found within the shipment dates, it's quite easy to calculate the total distance travelled (calculate the distance from point to point, add). This means, all we need to do is fetch all AIS data points for a given vessel during the right time period.
Solution 1: Build our own historic AIS database
If we were to receive a live AIS stream from Spire, and store it, we could build our own AIS database. This would give us complete control over how we access the data.
While this solution is cool and interesting from an engineering perspective, there are a couple of clear cons. The most relevant being, paying a premium for a live data stream, when we don’t need to track vessels in real-time. Speed of implementation, was also a relevant factor. There are more details to account for in a solution where we accumulate ~38GB of AIS data daily.
Solution 2: Integrate with Spire’s Historic Vessel Tracks API
Spire conveniently provides an API to query the position log of a vessel within a provided time period. Its response times are quick enough for our use case, and it was an easy decision to integrate with it.
We also decided to implement some validations on our side, to ensure that the data we get back from Spire makes sense given the shipment's departure and arrival locations.
AIS tracking in action
By early March we were ready to launch! AIS tracking is live, and customers can now leverage this new feature on any sea shipment calculation made through the Lune API. Here’s an overview of how it works.
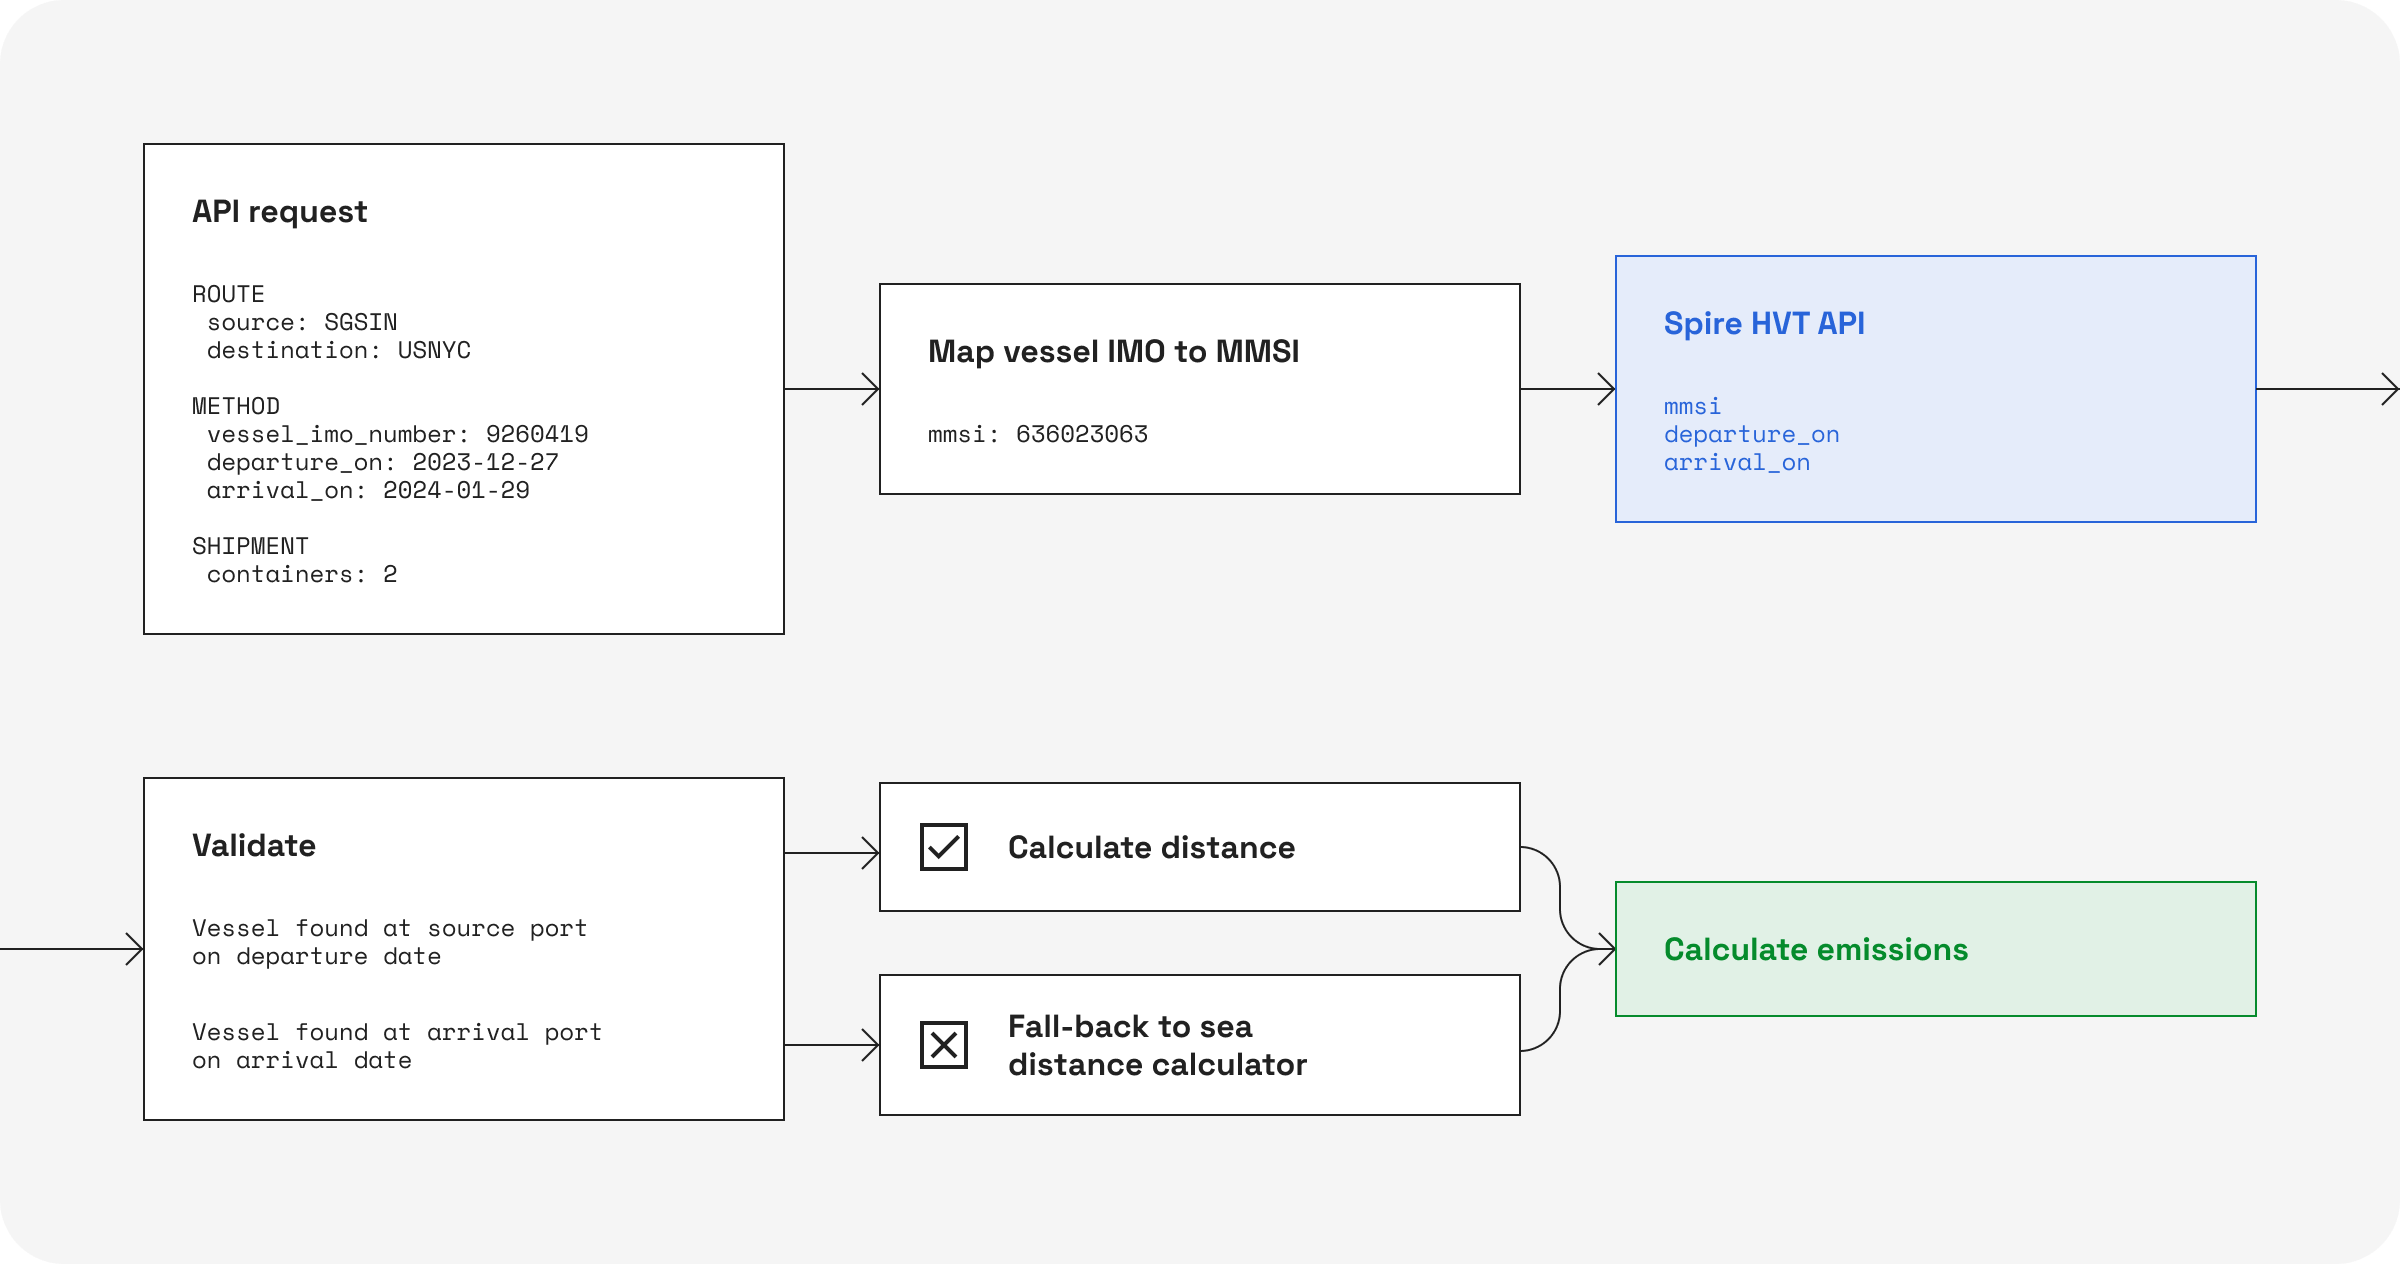 An flow chart overview of Lune’s AIS tracking
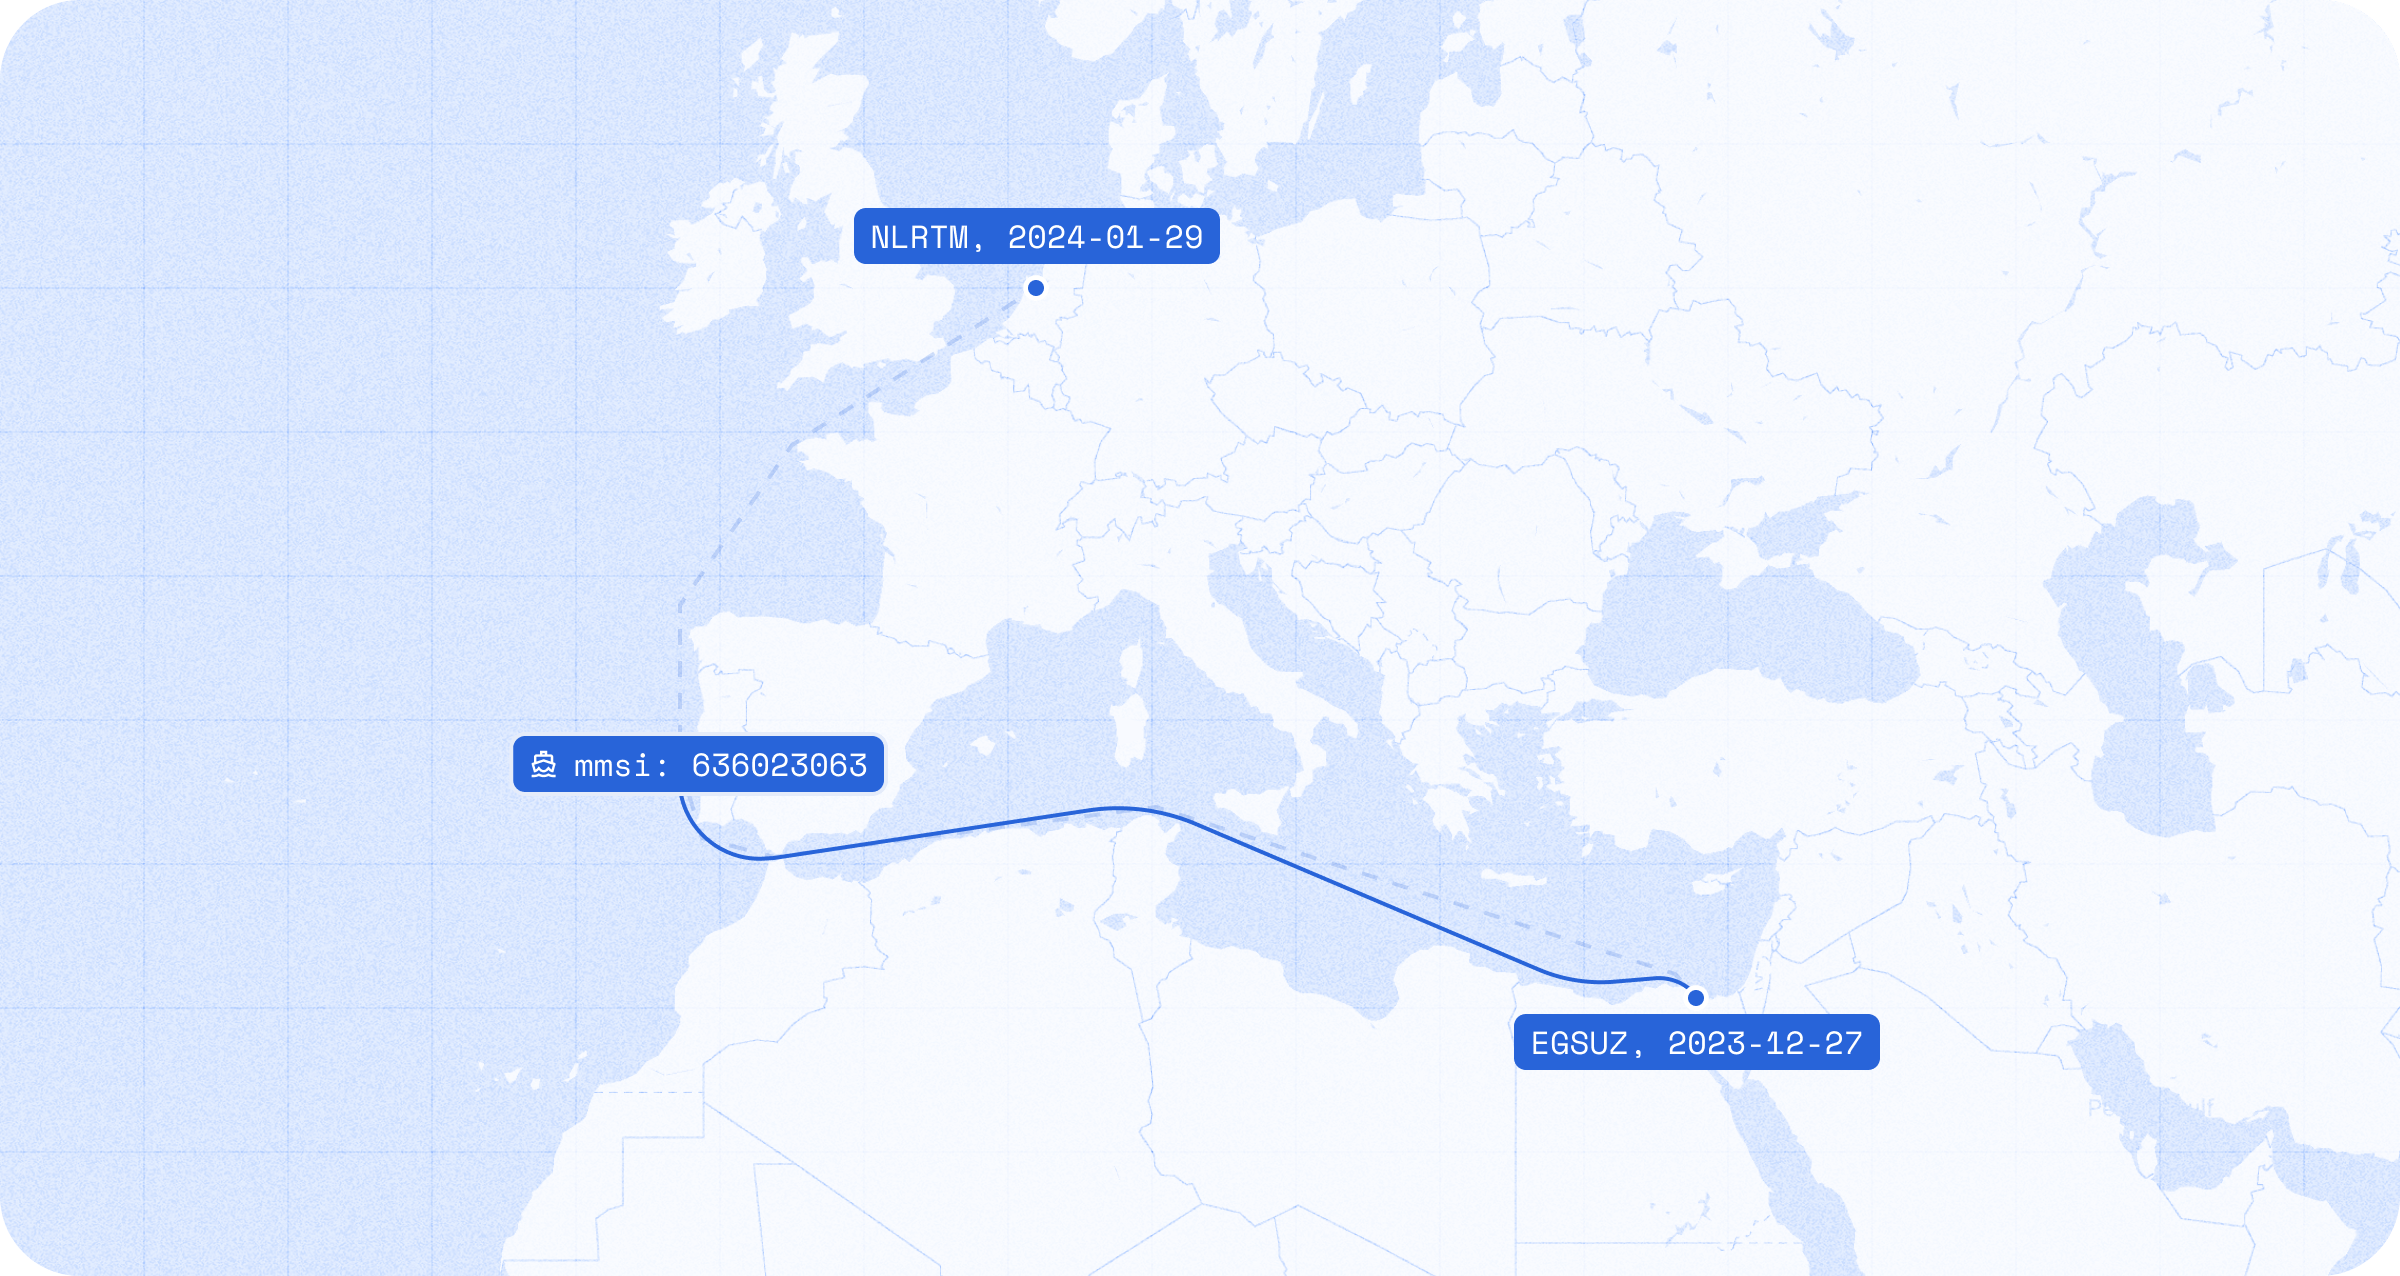
We are particularly proud of how easy it is to audit calculations via our Lune Analytics pages, and for AIS informed estimates; we've added a map to make it even easier to see where your shipment went. Here you can see a shipment made last month from Singapore to Hamburg.
Our biggest challenge in this project was trying to decide exactly what kind of AIS data would be sufficient. We are really pleased with the results we are seeing so far, and will continue to improve on it in the future.
At Lune, the case is clear, accurate carbon emission calculations rely on accurate sea distance calculations. Vessel tracking is as accurate as it gets 🚀.
For more information on how to ensure your shipment estimates use vessel tracking, our how to vessel track integration guide can be found here.
Readers also liked
Readers also liked


Subscribe for emissions intelligence insights
Get the latest updates in the world of carbon tracking, accounting, reporting, and offsetting direct to your inbox.