
Nature-based climate projects have the power to simultaneously address climate change, biodiversity loss, and humanitarian crises. But too often these projects are plagued with lack of transparency, escalating the risk of accidental greenwashing.
Yet, these projects are essential to reaching net zero. To make it easier to validate the nature-based projects delivering climate impact, Lune customers can dig deeper using new project impact maps.
What are project impact maps?
Lune is adding new visual data layers to climate project pages in the form of maps. Ranging from forestry loss, land use, climate and biodiversity impact, these maps give customers a better window into where their climate contributions are going.
Now, sustainability leads can visually validate green claims, gain a better understanding into the particular risks each project might carry, and pass the project’s story onto their customers using these maps.
As a trusted provider of high quality carbon credits, we believe that it’s our responsibility to share our findings with the highest degree of transparency, and communicate them in a way that’s easy to understand.
Previously, we’ve added insights on the project impact, our risk assessment, as well as recent news articles. While that’s already a step-up from the status quo, the new project impact maps inject an unprecedented layer of transparency.
A window into what’s happening on the ground
Climate projects are complex by nature. High quality projects require a multitude of actors, are embedded in local financial and cultural dynamics, and follow different methodologies. It’s a lot to digest. Here we show how businesses can use the new project impact maps as a window to better understand what’s happening on the ground.
1. What drives deforestation in Katingan?
As of 2022 Central Kalimantan – a large region in Indonesia where our Katingan Peatlands project is – had suffered a loss of about 25% of its tree cover compared to 2000, equivalent to 23.7 million tonnes of CO₂e released into the atmosphere.
The Katingan Peatlands project area – in contrast – has largely been able to protect the forest within its perimeter, avoiding the emissions associated with deforestation and peat soil oxidation.
 2001 – 2020 forest loss around the Katingan Peatlands project. Hansen/UMD/Google/USGS/NASA, powered by Resource Watch.
Central Kalimantan is designated as “production forest”, meaning that the government allows for the land to be used for commercial purposes. The two main activities are land conversion for oil palm farming, and logging to produce wood fibre destined to the growing Indonesian paper industry.
Oil palm and wood fibre concessions are common around the Katingan project area and have historically put pressure on the project itself.
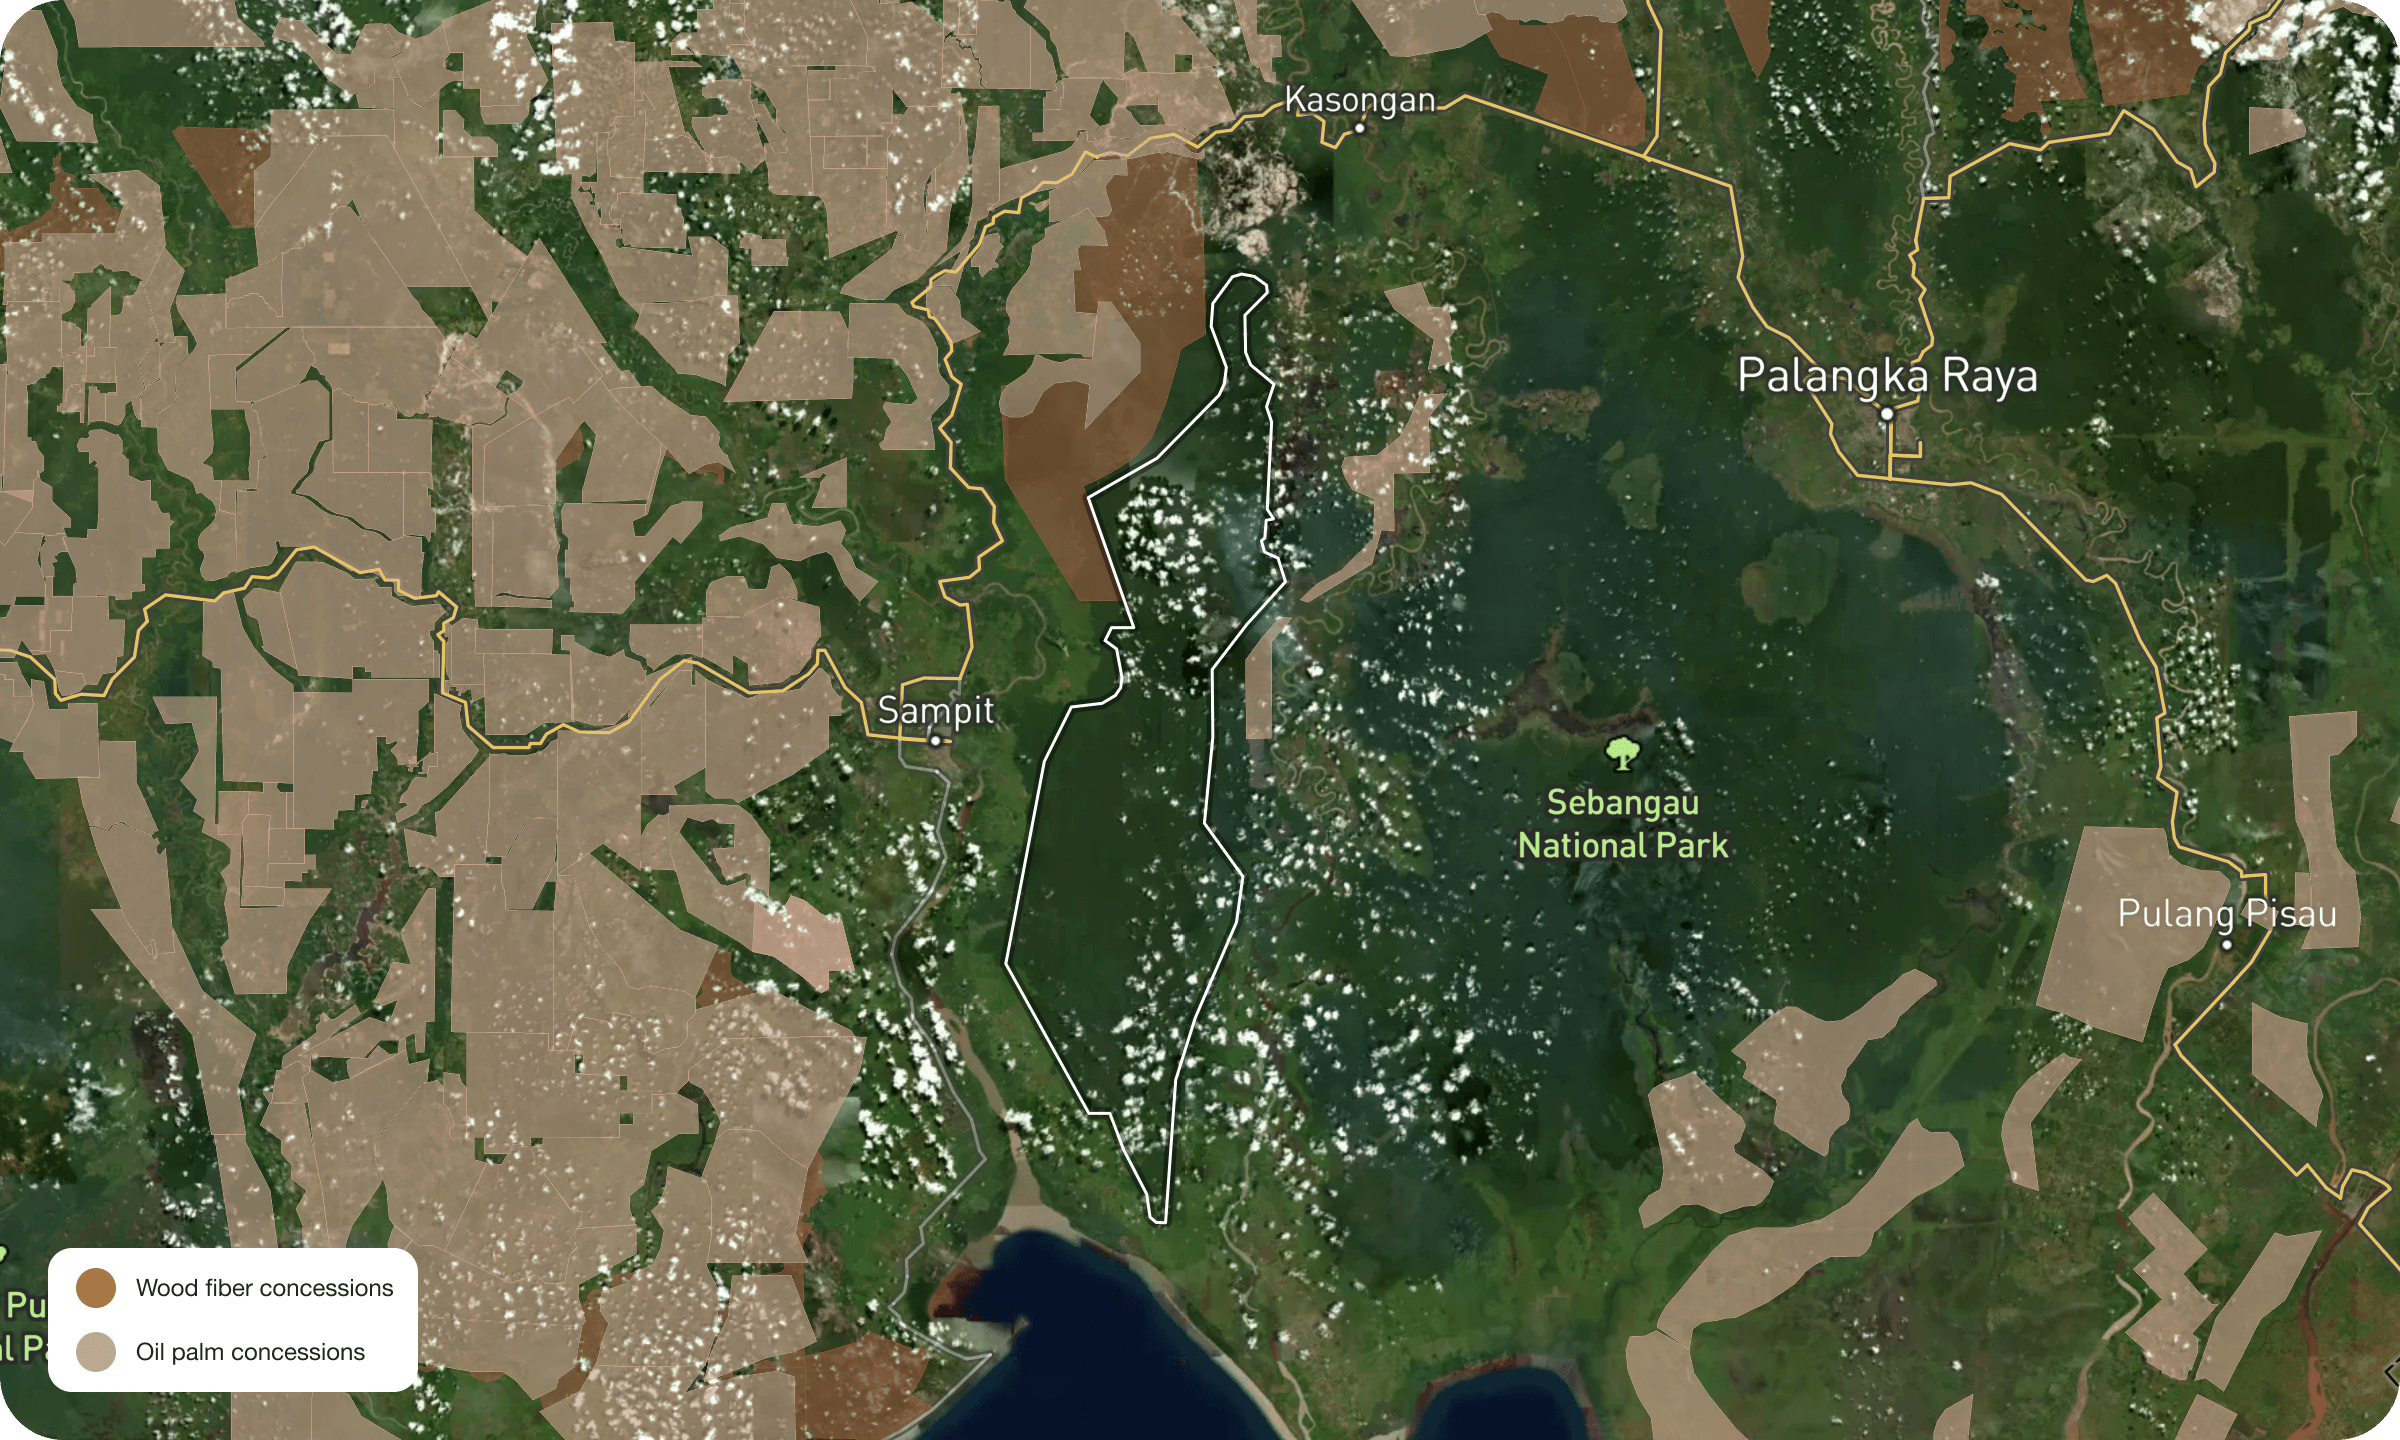 2023 oil palm concessions and 2019 wood pulp concessions. Indonesia Ministry of Forestry/Asia Pulp and Paper/APRIL, accessed through Global Forest Watch.
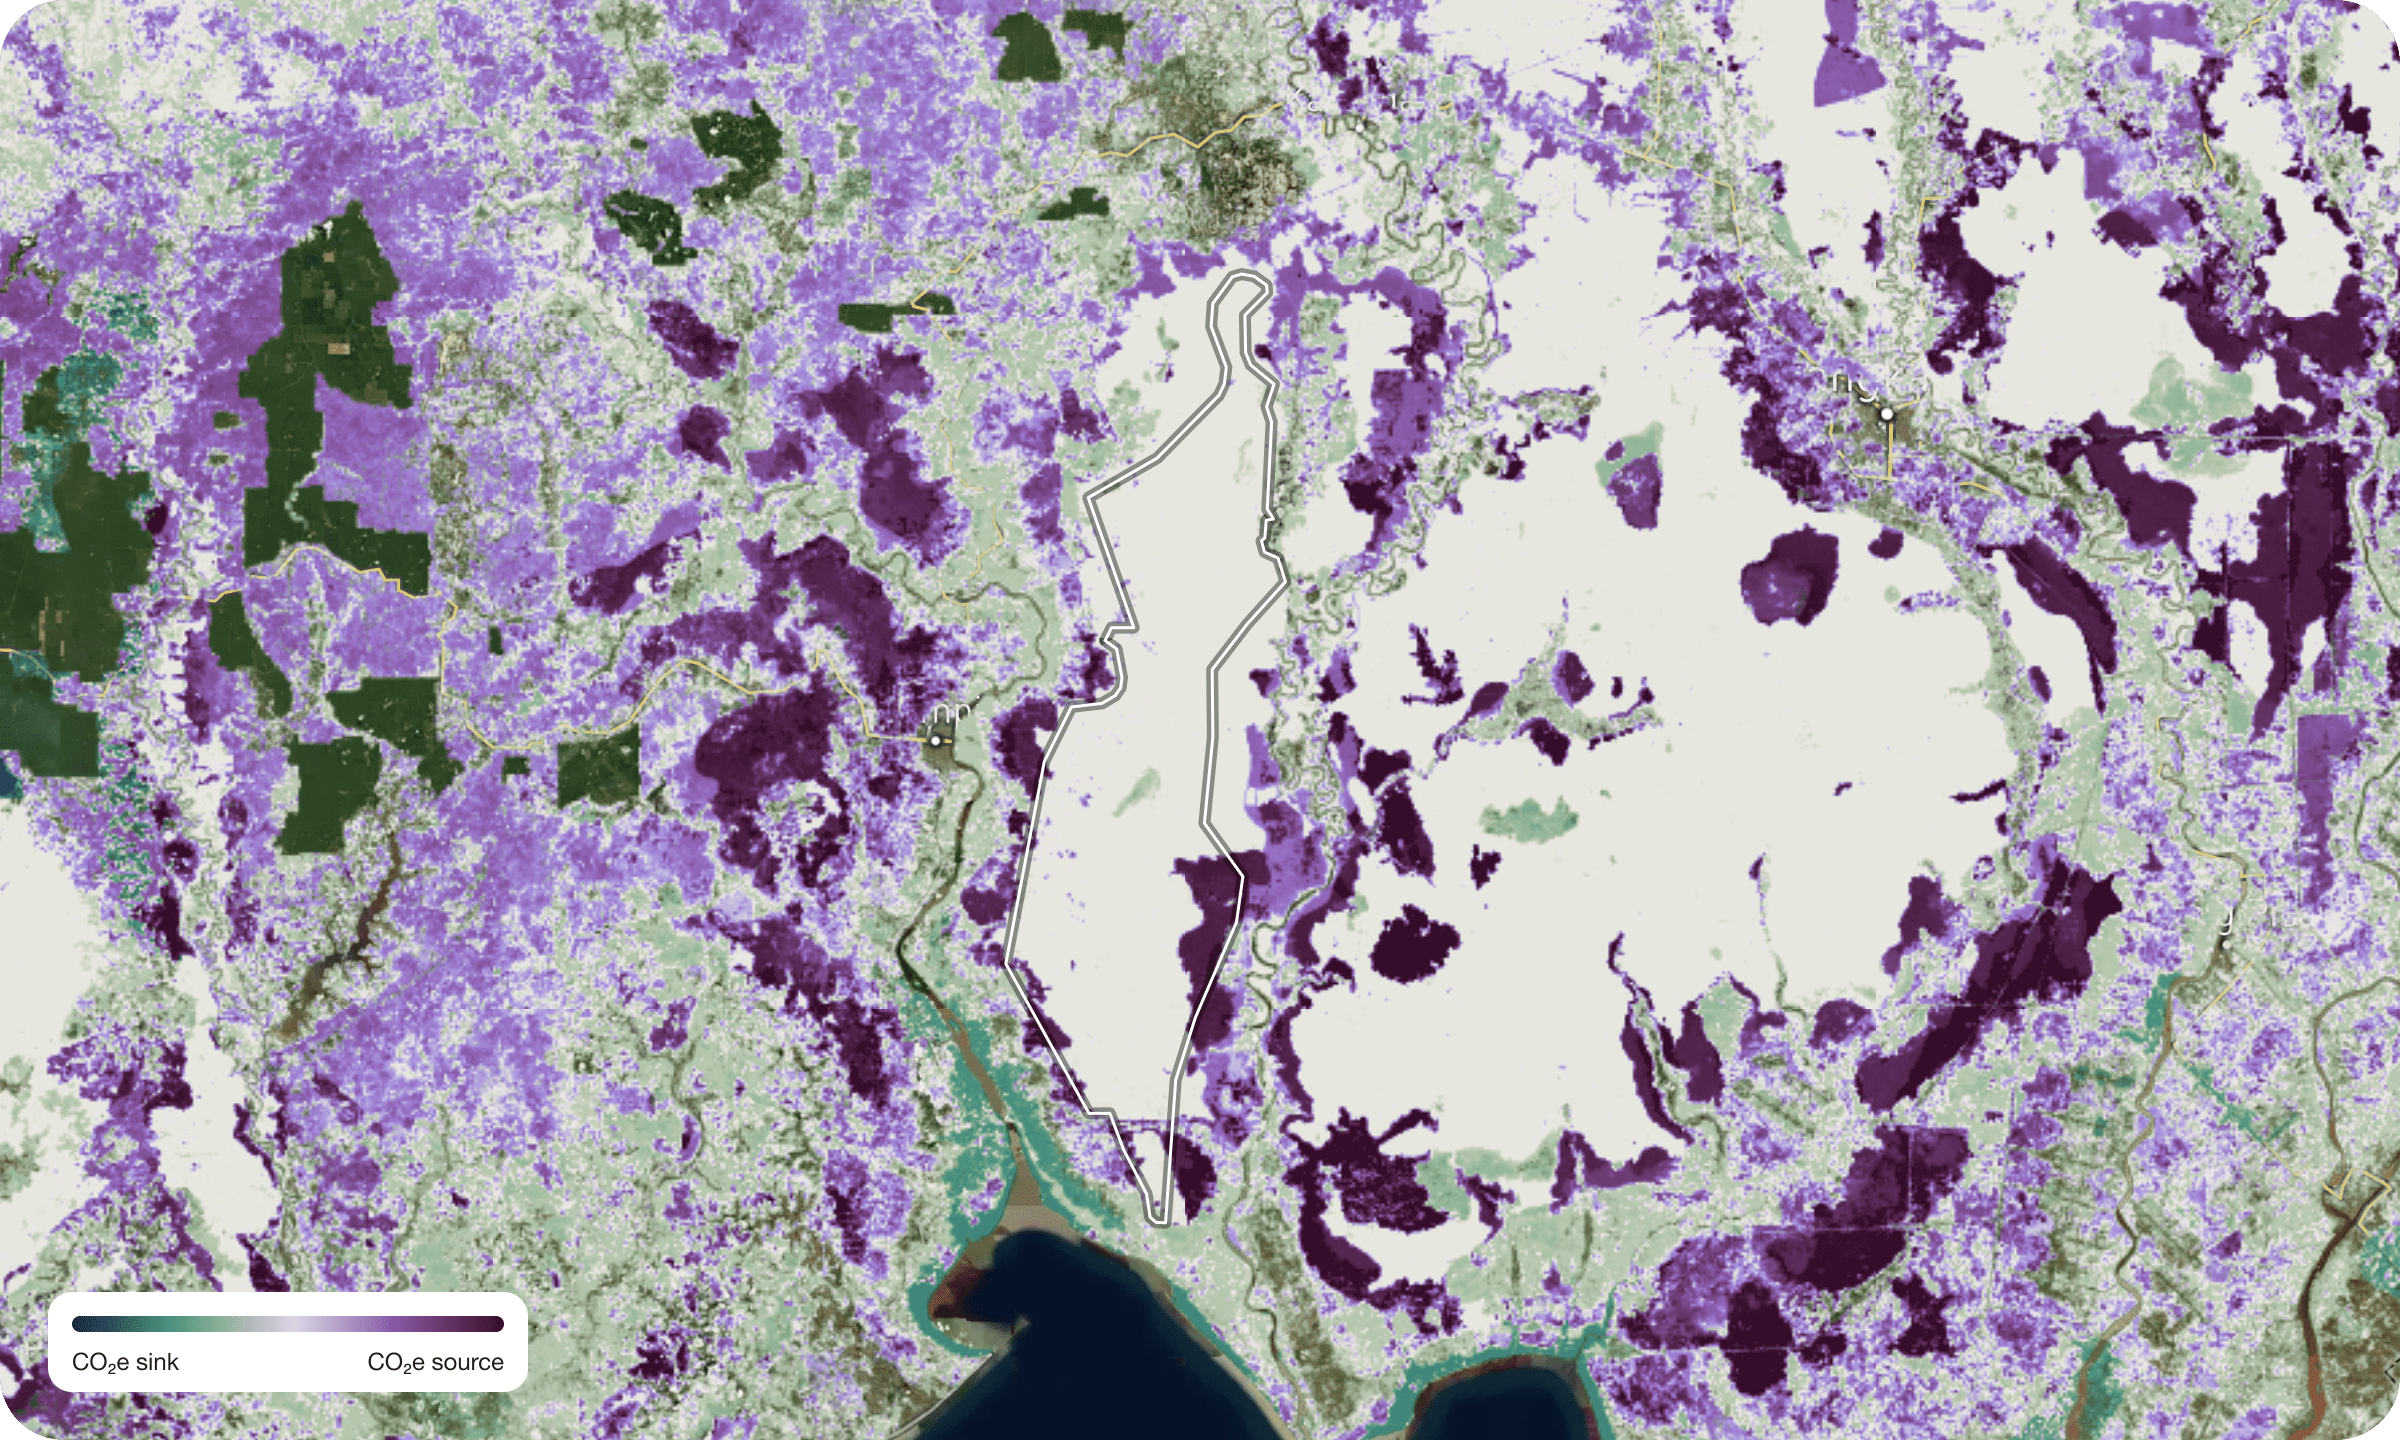
2. What does the impact of deforestation in Katingan have on CO₂e net flow?
Analysing the period between 2000 and 2020, this dataset shows forest areas that have been a CO₂e sink, and those that have been a CO₂e source.
Looking at Katingan again, we can see that the project area (and the neighbouring national park) has broadly been neutral when it comes to GHG emissions. On the other hand, deforested land in the area have turned dark purple (strong GHG source), but why is this the case?
Deforestation is always a driver for GHG emissions. The speed and amount of emissions varies depending on a few factors, including the type of forest, the type of soil and the end use destination of the land.
In this example, the loss of peat soil is one of the main culprits: peat soil is rich in carbon, but its oxidation associated with deforestation results in the releasing of the carbon it had been holding.
3. How significant is Alaskan forest to biodiversity?
Beyond greenhouse gases, forests are hugely important to maintaining biodiversity and protecting endangered species of plants and animals alike.
The Forest Biodiversity Significance dataset shows how important each “pixel” of forest is to biodiversity. More purple areas show forests that are more important to biodiversity:
- Forests hosting more species are valued more
- Forests hosting more endangered species are valued more
- Forests hosting species that exist in smaller areas, globally, are valued more
- Only forest-dependent birds, mammals, amphibians and conifers are considered
Below you can see the biodiversity significance map around the Kootznoowoo Improved Forest Management project, located in Alaska. It’s noticeable how the coastal forest areas are more important to biodiversity.
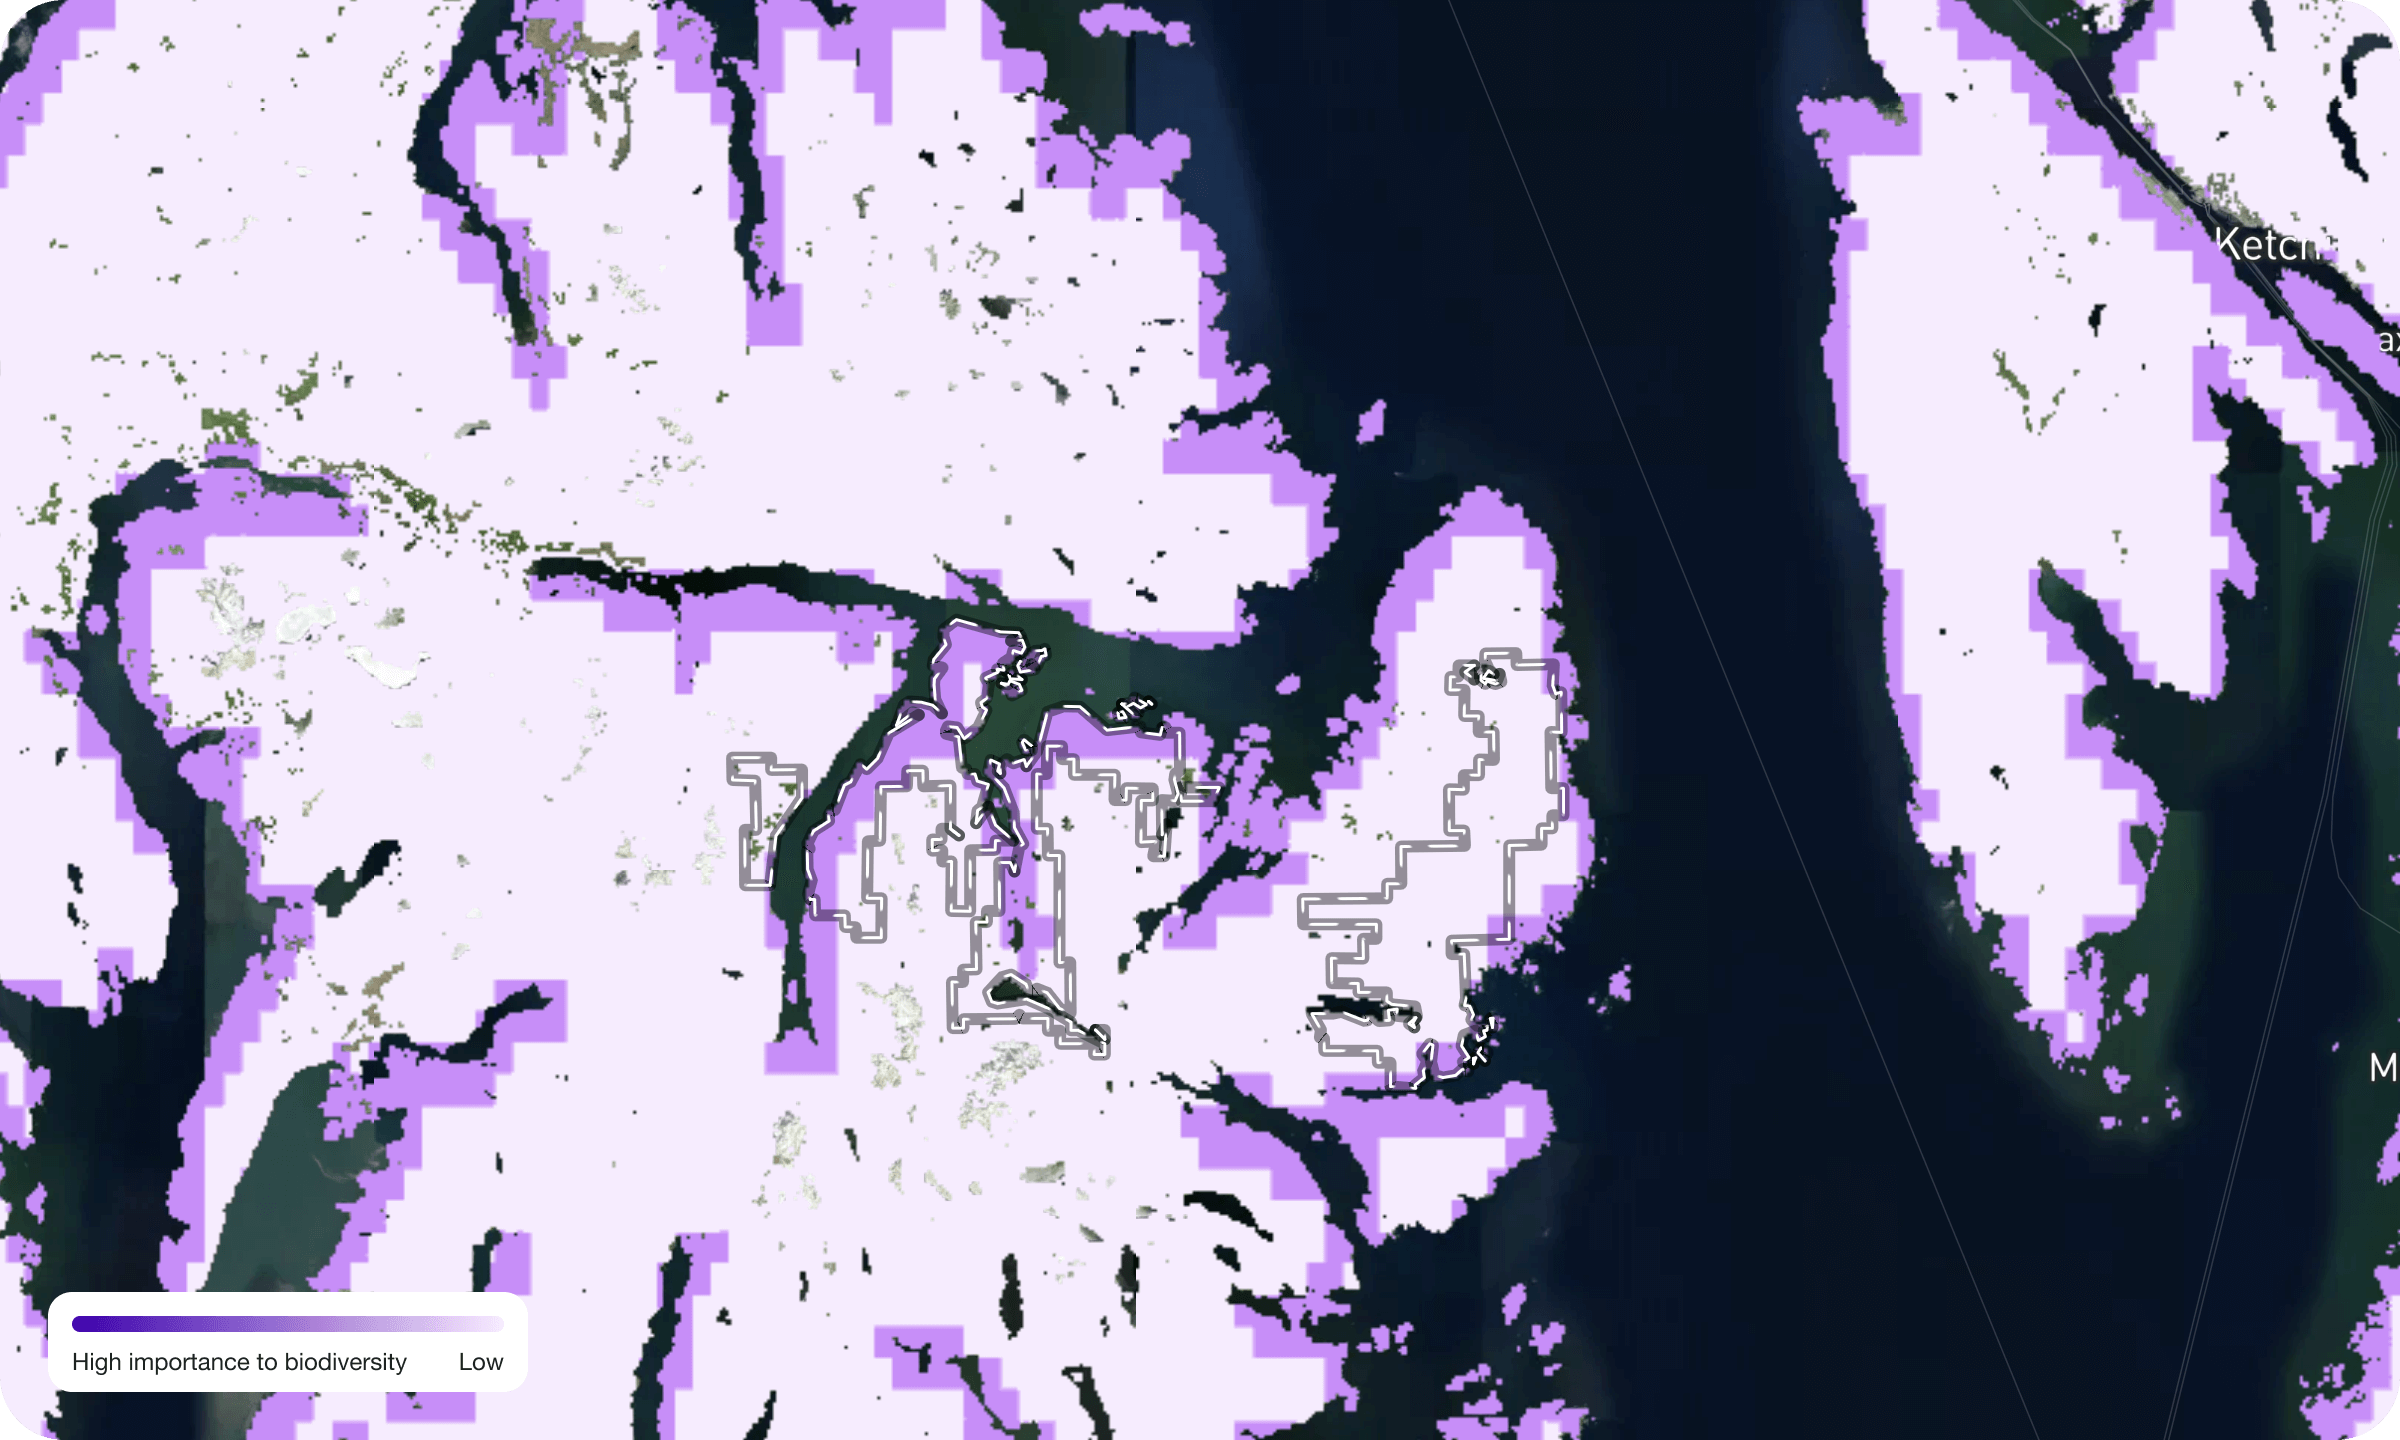 IUCN, BirdLife International, and UNEP-WCMC (2019). “Biodiversity Significance”. Accessed through Global Forest Watch.Approximate perimeter.
Lune customers can also explore the area outside the project to deepen their understanding of its impact. For example, the maps below show scaring resulting from aggressive deforestation outside the Kootznoowoo project area. By comparing these maps you can see how forest loss has negatively affected biodiversity.
This, in our opinion, underscores how important it is that local communities can generate an income derived from selling the carbon credits that fund these projects. This means they don’t need to resort to logging as an income source which would further reduce the few pristine forests left, and threatening the species that call them home.
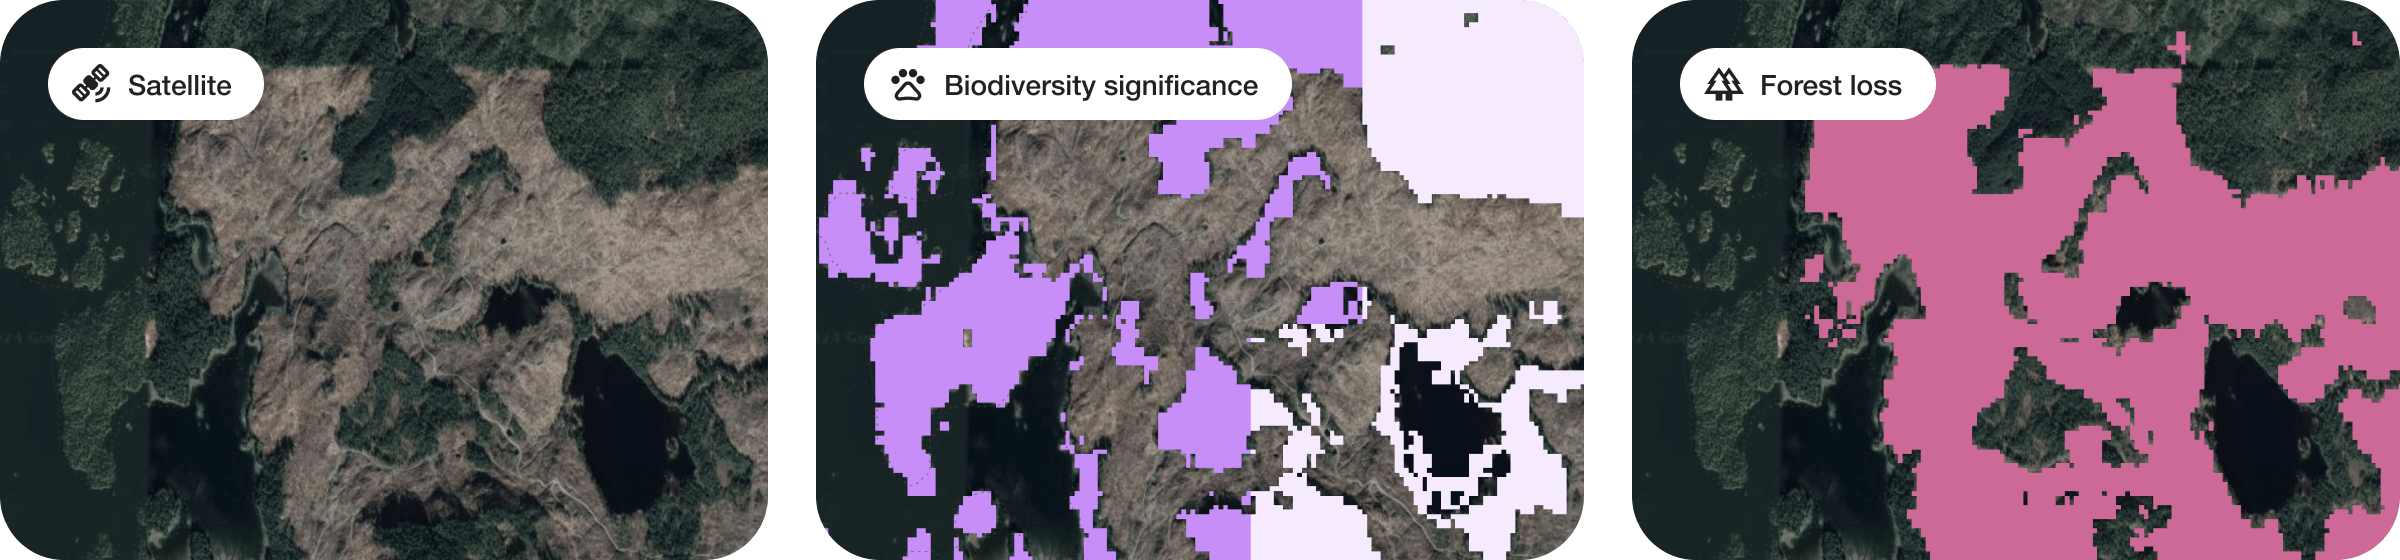 A comparison of forest biodiversity significance, satellite and forest loss maps to show the impact of heavy deforestation nearby the Kootznoowoo project area.
4. Why do mangroves need protecting and restoring in Pakistan?
Mangroves are important in the fight against climate change as they sequester up to four times more CO₂ than rainforests. Mangroves also play an essential role in protecting coastal areas from erosion, storm surges, and rising sea levels – which is of particular relevance in Pakistan.
Over the past decades along the Indus River Delta in Pakistan a reduced freshwater supply (due to increased usage upstream), grazing and wood exploitation have severely impacted the number of mangroves compared to neighbouring areas. The map below validates the extent of mangroves loss.
It had to stop. And so, the Delta Blue Carbon project was born in 2015.
The project protects and restores the existing mangroves. On top of this, the project is also planting new mangrove seedlings in carefully managed plant nurseries. Once the seedlings are big enough, they’re then planted out into the existing mangrove ecosystem to increase the forest’s potential.
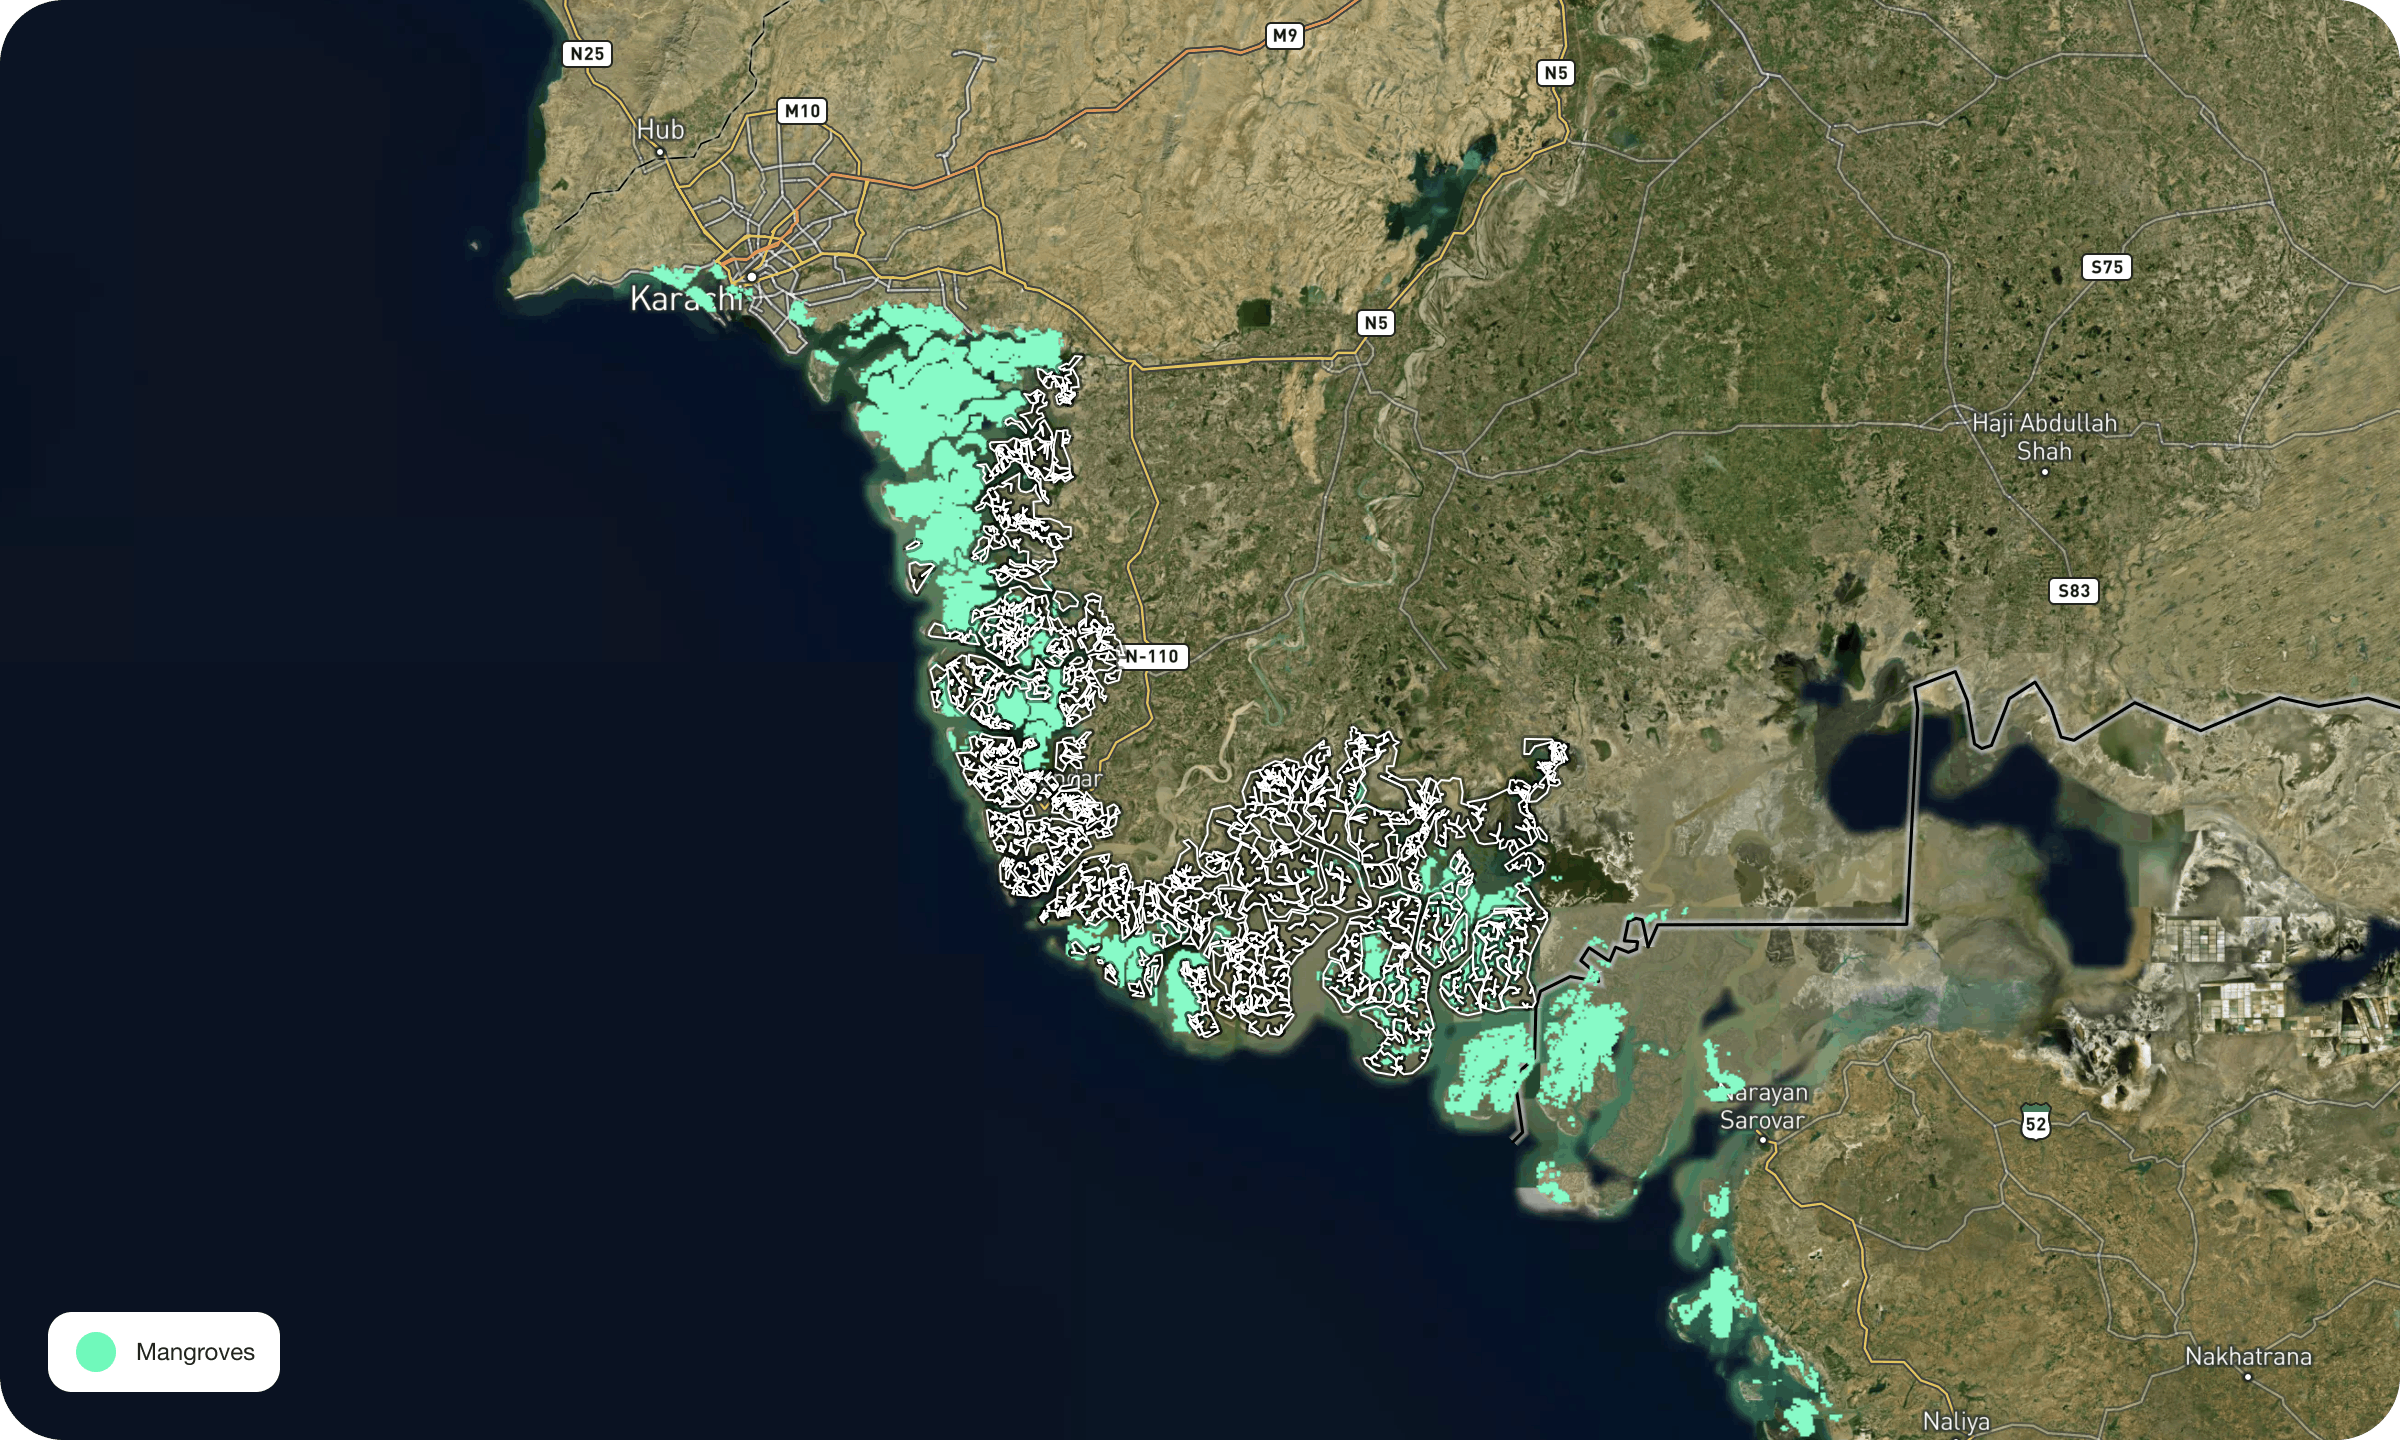 Global Mangrove Watch map, 2016. Global Mangrove Extent (v2.0), accessed through Global Forest Watch.
5. What’s the added carbon benefit of mangrove ecosystems?
Mangroves are not only faster at sequestering carbon from the atmosphere, but – as seen in the map below – they can also keep up to 80 times more carbon in the soil they grow in. Their dense root systems trap sediments, and the low oxygen conditions of their waterlogged soils slow down the decomposition of organic material.
The soil carbon density map shows how soil in the presence of mangroves can retain up to 400 tonnes of carbon per hectare, compared to as little as 5 tonnes where mangroves don’t grow. It validates the potential carbon benefit of Delta Blue’s work, which will remove 2 million tCO₂e every year.
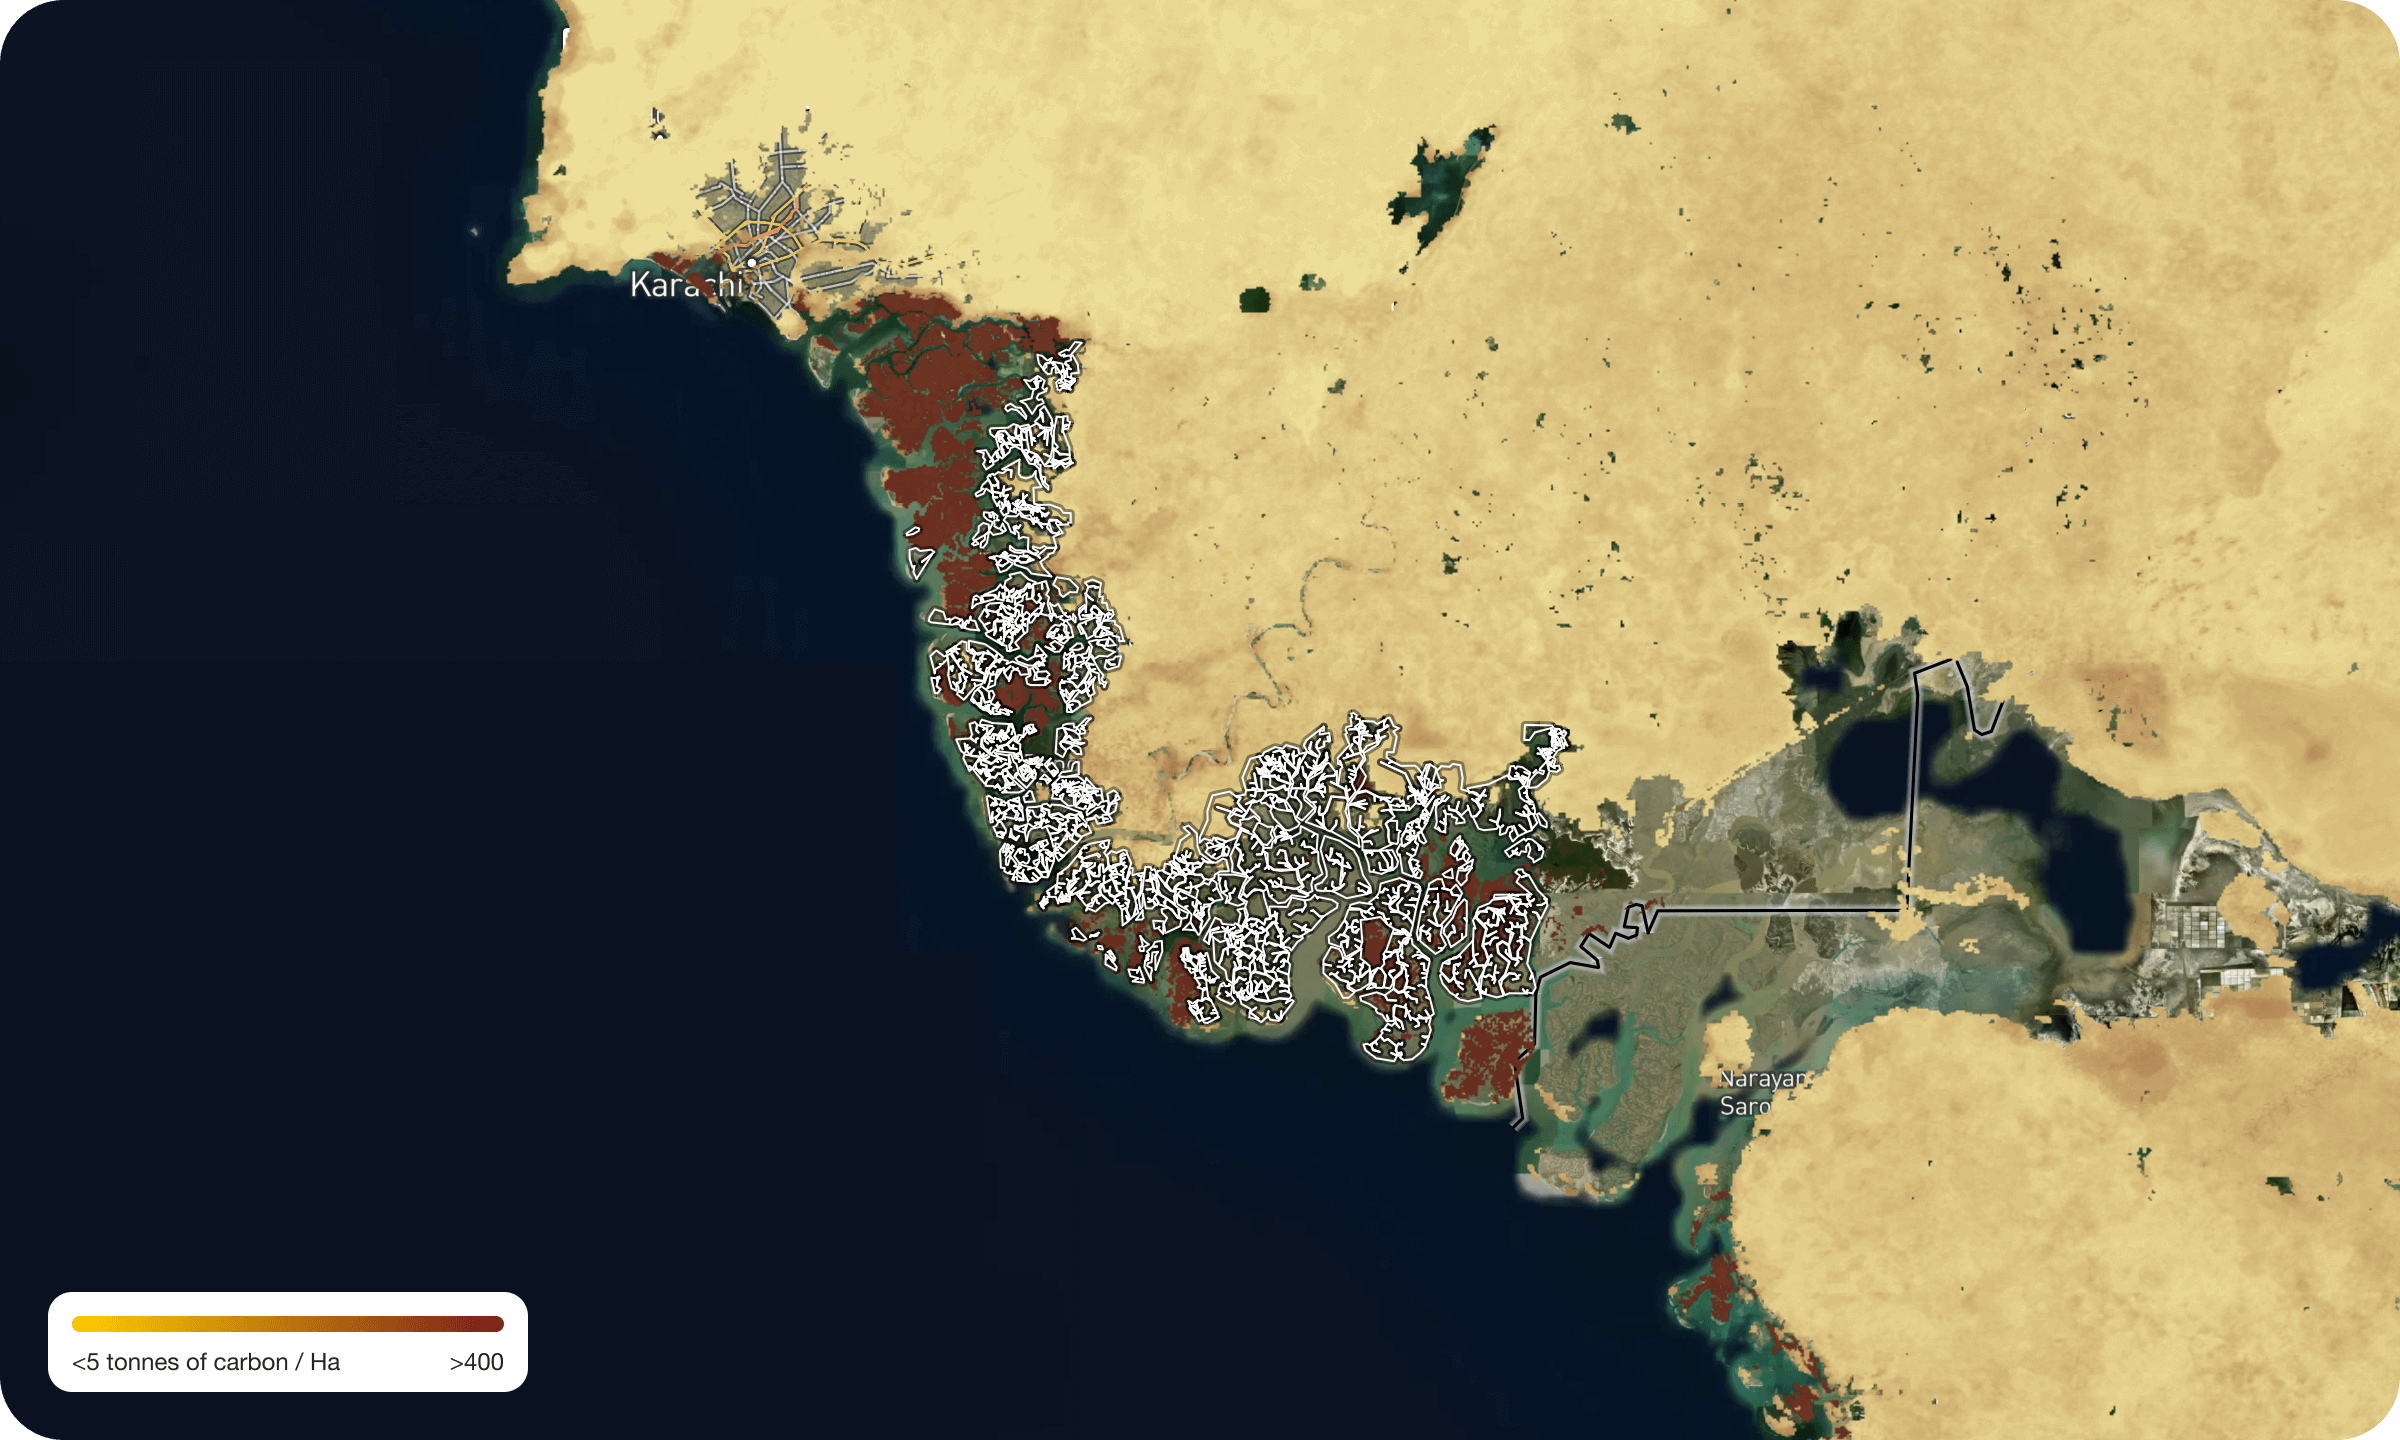 Soil Carbon Density map, 2020. World Resources Institute/ISRIC/Sanderman et al., accessed through Global Forest Watch.
See where your climate contributions go with Lune
The new project impact maps add a new layer of transparency and integrity to the nature-based climate projects featured in Lune’s curated library of carbon credits. Both integrity and transparency are key to any climate strategy. Using this new tool customers can visually validate green claims, and share the tangible impact of their climate contributions with peace of mind.
If you’re ready to inject a new layer of transparency into your carbon removal strategy with Lune, request a demo today.
Readers also liked
Readers also liked


Subscribe for emissions intelligence insights
Get the latest updates in the world of carbon tracking, accounting, reporting, and offsetting direct to your inbox.